As in “a picture is worth a thousand words”,
“un bon croquis vaut mieux qu'un long discours”,
"百闻不如一见", or "As the Chinese say, 1001 words is worth more than a picture."!
FEDS Notes
Between the Lines


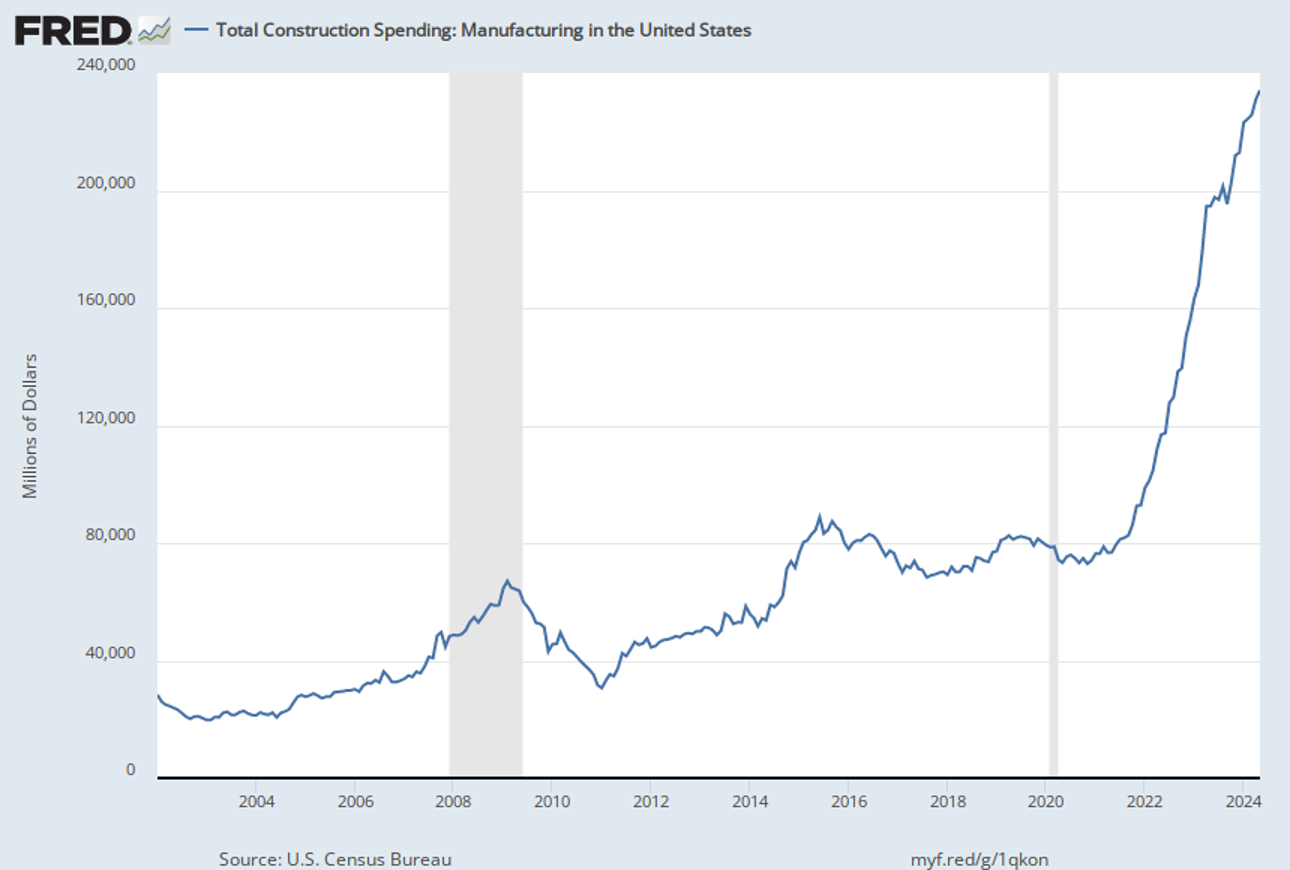
Total Construction Spending: Manufacturing in the United States
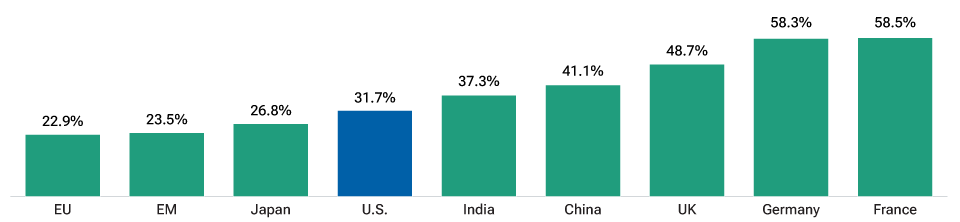
Weight of top 10 stocks in MSCI country equity indices
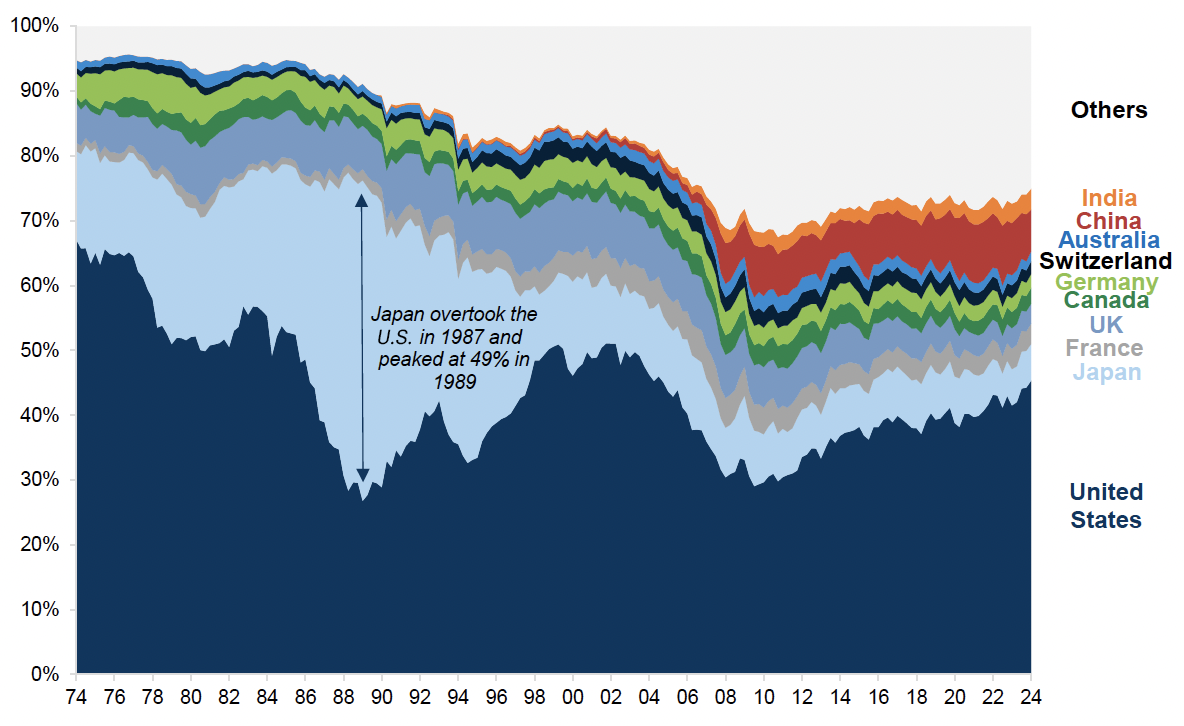
Country shares of global equity markets
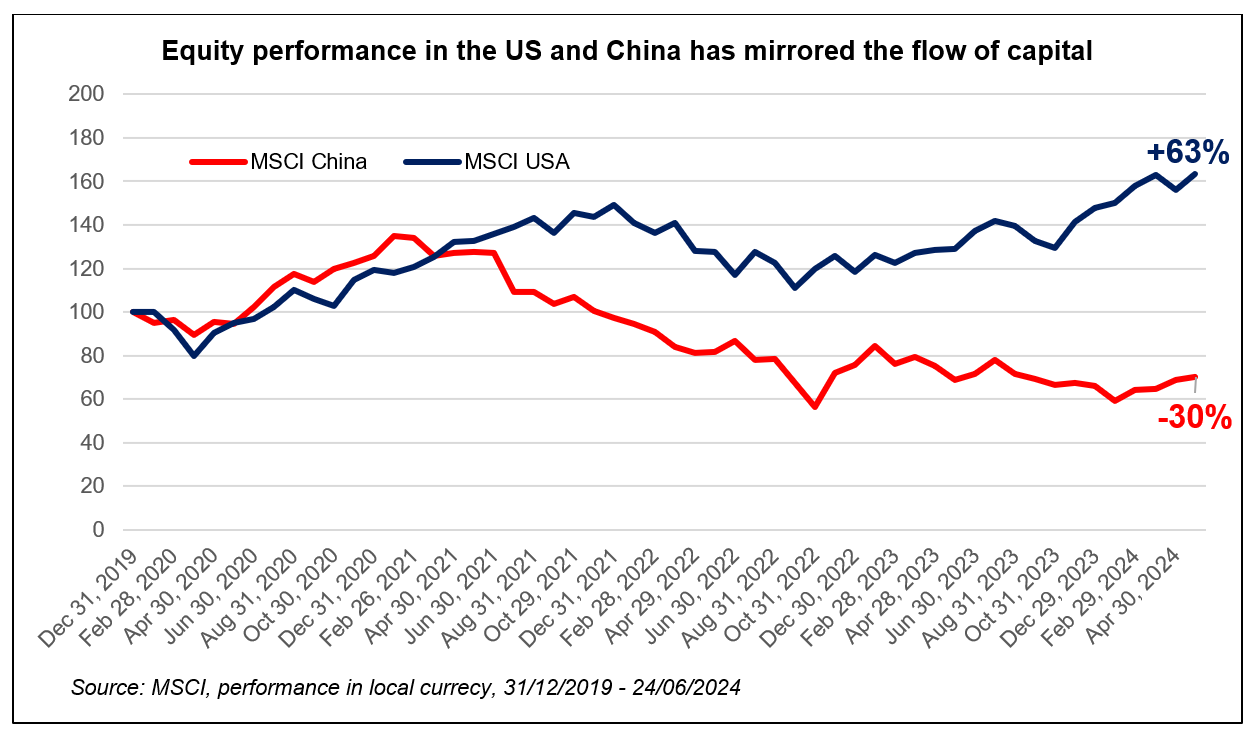
Equity performance in the US and China has mirrored the flow of capital