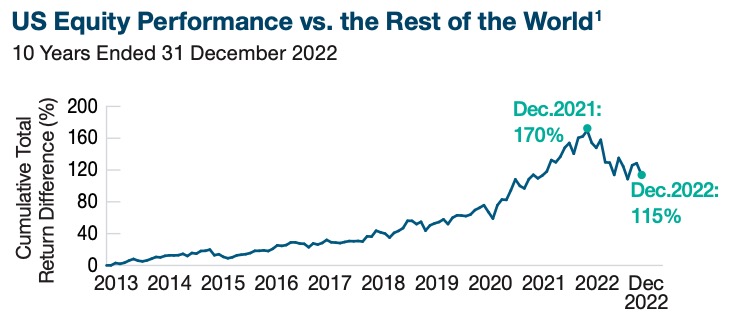
10 Years Ended 31 December 2022
10 Years Ended 31 December 2022
Past performance and hypothetical performance are not reliable indicators of future performance. Actual performance will vary, perhaps materially, from the performance shown. The performance of the hypothetical portfolio does not include fees or costs. If these fees were deducted from the returns shown, the returns would be lower.
1. Source: FactSet. References the MSCI U.S. and MSCI All Country World ex U.S. Indices. Figures shown in local currency.
This chart is sourced from the report Global Asset Allocation: The View From Europe, T. Rowe Price, February 2023