Financial markets have evolved over time. The relationship between stocks and bonds differed in each of the eras that Global Financial Data has designated in the past: Mercantilism (1602-1800), Free Trade (1800-1914), Regulation (1914-1981) and Globalization (1981-).
Dr. Brian Taylor
Global Financial Data, Aug 14 2019
Bonds have always been used primarily as a source of income with inflation and the risk of default affecting the price and yield on the bond. Stocks, on the other hand, have evolved over time. Higher earnings and thus capital gains have become the main driver of stock prices since higher earnings mean higher cash flows in the future to shareholders.
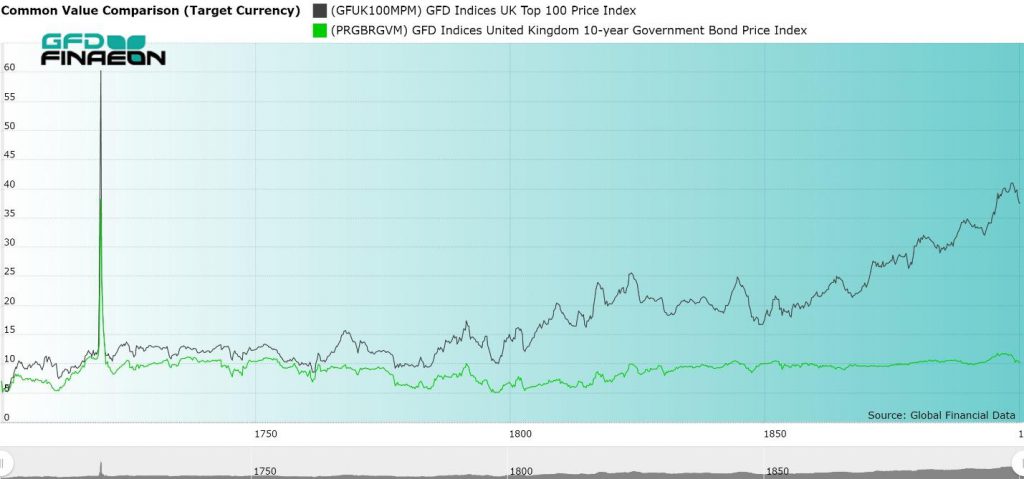
The relative performance of stocks and bonds in the United Kingdom since 1700 is illustrated in Figure 1. The graph shows how this relationship has changed over time. As can be seen, there was a strong correlation between stocks and bonds in the 1700s. During the 1800s, the price of bonds generally rose, but slightly and showed little change over time. Equities, on the other hand, rose in price, first gradually during the first half of the century, then strongly after 1850. As Figure 2 illustrates, there was almost an inverse correlation between stocks and bonds during the period of Regulation between 1914 and 1981. The price of bonds fell as inflation rose, but equities rose in price both when inflation occurred and when there was no inflation. Since 1981, the correlation has been positive with the price of both stocks and bonds rising, bond through falling inflation and quantitative easing, and stocks through higher profits.
Let’s see how the relationship between stocks and bonds has evolved over time.
Figure 1. Stocks and Bonds in the United Kingdom, 1700 to 1900
Mercantilism (1600-1800)
During the period of Mercantilism (1600 to 1800), income was king. Just as today, bonds trade in parallel with each other, going up and down in price together, with only small differences in the yields according to the risk of default, the same was true in the 1700s. Back then, there were about two dozen securities that traded in Paris, London and Amsterdam. Most of the securities were bonds, but a few were international trading companies, such as the East India Company, which were backed by the central government of each country. In a way, virtually all of the securities that were traded were government-backed securities which paid dividends or interest. Although the interest on bonds did not change, the dividends paid on individual securities did, though rarely. When the dividend changed, the price of the security rose so the yield stayed around 5%. If you look at Figure 1, you can see that stocks (black line) and bonds (green line) exhibited the same movements up and down, but the stocks outperformed the bonds over the course of the century because of the greater risk to shareholders. This risk was borne out during the Napoleonic Wars when companies in France and the Netherlands were closed and every country except the United Kingdom defaulted on their bonds, either skipping interest payments or replacing old bonds with new bonds at a lower value. Bondholders in France and the Netherlands lost two-thirds of their capital when the sovereign debt was refinanced..
During the 1700s, the amount of outstanding debt grew dramatically relative to equity. In 1692, the market capitalization of stocks and bonds in the United Kingdom were each around £1 million, but by 1820, the British stock market had grown in size to £50 million and British government debt to £800 million. After the collapse of the South Sea and Mississippi Bubbles, investors preferred government bonds to equities. The 1700s were more a market for bonds than for stocks, but this would change in the 1800s.
Free Trade (1800-1914)
During the period of Free Trade, investors differentiated stocks and bonds into separate categories. The 1800s was a century of peace so the risk of default due to war by countries such as the United Kingdom, France or the Netherlands was almost nil. The yield on bonds fell to the 3% range in London and stayed there for most of the century. Bonds issued by emerging markets such as Greece, Portugal, Spain or South America, however, did run a risk of default, and emerging market government bonds were riskier than the blue-chip stocks that traded in London. Some governments missed interest payments for decades and had to refinance their debts imposing losses on investors.
The stock market was revolutionized by the Canal Bubble of 1793 when dozens of canal stocks were issued leading to the first stock market bubble since the South Sea Bubble of 1720. The bubble ended quickly, but two new canal bubbles occurred between 1806 and 1810 and in the 1820s. The Railway Mania of the 1840s led to a doubling in the value of transportation stocks in the United Kingdom before they collapsed after the bubble burst. Before 1800, each company only issued one security to shareholders, but in the 1840s, a single company could issue a dozen different classes of shares including partial shares, preferred shares, ordinary shares, deferred shares, bonds, and auxiliary shares. Each class was created to appeal to a particular group of individual investors.
Equity prices made little progress between 1800 and 1850. Between 1850 and 1914, however, there were no bear markets in equities in the United Kingdom. Instead, stocks move up steadily in price as Figure 1 shows. Because British Consols had virtually no risk, they hardly changed in price. The coupon on Consols fell from 3% to 2.75% to 2.5% between 1881 and 1907. Consequently, stocks and bonds became separate types of securities. Bonds were purchased for income, and equities for capital gains. American railroads issued billions of dollars in stocks and bonds in New York, Amsterdam and London to pay for the railroads that crisscrossed America.
Because the 1800s were a century of peace, the amount of outstanding British debt hardly changed and stayed at roughly £800 million throughout the century. Equities, however, grew in size dramatically. Stocks provided more of an opportunity for growth and their capitalization in the United Kingdom grew from £50 million to £700 million between 1815 and 1914. Meanwhile, the value of U.S. stocks grew from $20 million in 1792 to $20 billion in 1914, a phenomenal 1000-fold increase in stock market capitalization. The size of the US stock market increased another 1000-fold between 1914 and 2019 growing from $20 billion to $20 trillion. Will the stock market increase another 1000-fold over the next 100 years?
Regulation (1914-1981)
The period between 1914 and 1981 was one of economic regulation. The government heavily regulated the economy during World War I and World War II and the mismanagement of the economy by the Federal Reserve contributed to the depth of the Great Depression in the 1930s. Although the relatively open economy that prevailed after World War II benefited shareholders, rising inflation and thus rising interest rates imposed losses on bondholders.
By 1914, stocks and bonds were seen as substitutes for one another. Between 1914 and 1981, the prices of stocks and bonds moved in opposite directions. The Federal Reserve was founded in 1913 and in 1914, World War I began leading to a large increase in the number of outstanding bonds as governments absorbed outstanding capital to pay for the war. Although yields declined and bond prices rose during the 1930s and 1940s, between 1950 and 1981, interest rates in the United States steadily rose, peaking at 15.84% in 1981. Although the Federal Reserve was created to control inflation and thus interest rates, it failed in the 1970s as both inflation and interest rates rose to their highest levels in peacetime.
Stock prices rose between 1914 and 1981, though mainly in line with inflation. Between April 1901 and April 1982, there was virtually no change in the S&P 500 stock price index after adjusting for inflation. Between 1981 and 2019, on the other hand, the S&P 500 increased ten-fold after adjusting for inflation.
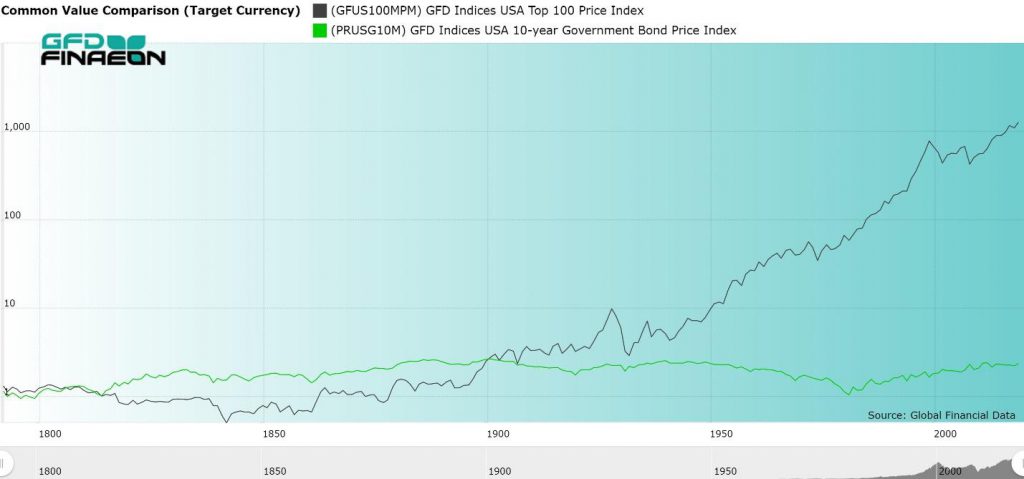
Between 1792 and 1900, stocks and bond provided similar returns with stocks declining in price between 1792 and the 1840s, then rising in price for the rest of the century. Bonds, on the other hand, steadily rose in price during the 1800s as bond yields declined. The real difference in performance came after the 1930s when stocks continually rose in price while bond yields rose after World War II imposing losses on bondholders.
Figure 2. United States Stock and Bond Price Indices, 1792 to 2018
Globalization (1981-)
High inflation, high interest rates, the OPEC oil crisis, stagflation and other problems led to large losses to investors in the 1970s. The Keynesian policies of macroeconomic management had clearly failed. When Paul Volcker was appointed as chairman of the Federal Reserve in 1979, he reversed the policies of his predecessor to squeeze inflation out of the economy. As a result, inflation and interest rates have been declining in the United States for the past 38 years. Bondholders have profited immensely from the Fed’s policies since 1981.
During the past 45 years, market exchange rates have replaced fixed exchange rates, capital has been free to flow to wherever investors can get the highest returns, Communism has fallen, China has opened up to the rest of the world, billions of people have moved out of poverty, governments have privatized firms they previously nationalized, technology has improved dramatically, thousands of new firms have introduced products that didn’t exist before, and the capitalization of the global stock market has grown dramatically.
The result has been a win-win for investors as they have benefited from the globalization of world markets. But this has come at a cost. Stock markets have been more volatile with the Crash of 1987 producing the largest single-day decline in history, and two vicious bear markets in 2000-2002 and 2007-2009 which each wiped out over half of the value of stock markets worldwide. During the past ten years, stock markets have bounced back and the S&P 500 and the World Index both now trade above where they were at in 2009.
Conclusion
Stocks and bonds have behaved differently in each of the four historical eras of the past. During the period of Mercantilism (1601-1800), there was little difference in the behavior of stocks and bonds because both were backed by the central governments of each country. Equities emerged as a separate asset class during the period of Free Trade (1800-1914) with bubbles in canals (1793 and 1810), South American stocks (1825), and railroads (1840s) during the first half of the 1800s. During the second half of the 1800s, there were no global bear markets. There were periodic panics in 1857, 1870 and 1893, but equity markets recovered and continued to move upward until World War I began. Meanwhile, bond yields fell below 3% in the United Kingdom and other countries as capital was free to flow between countries. The period of Regulation (1914-1981) was inimical to investors. After adjusting for inflation, equity prices remained unchanged and rising interest rates produced losses for bondholders.
Since 1981, however, the reduction in government regulation of the economy, lower interest rates and the globalization of the international economy have provided immense benefits to investors. Today, investors face the threat of trade wars and currency wars which could reverse the period of growth and Globalization that has prevailed during the past 40 years. We can only hope that these fears are not realized and that politics doesn’t return the regulation that stymied investors between 1914 and 1981.