Key takeaways:
- An inevitable global cyclical recovery in activity and inflation is predictable after a recession and we have been expecting it; the bigger surprise was how reluctant US bond yields were to rise in the second half of 2020 in anticipation of this effect.
- What we have seen in the markets since the beginning of this year is a reflation frenzy that culminated in the indiscriminate sell‑off in bond markets around the globe — despite very different starting points for GDP growth levels, fiscal stimulus and the likelihood of rate rises. We see opportunities in UK and Australian duration as a result.
- We are not convinced that this cyclical rise in inflation is sustainable for three reasons: changing behaviours in households and corporates towards savings and debt, a weak China credit impulse and the fiscal cliff looming on the horizon.
Government bond yields have been at historical lows for many years now, reflecting a combination of structural changes and cyclical factors in the global economy. On the structural side, the private sector’s (households and businesses) impulse to save rather than invest has led to very low real (adjusted for inflation) interest rates, while on the cyclical side, declines in gross domestic product (GDP) growth, uncertainty about the future and a long period of low inflation expectations have played their part.
Government bond yields sank to their lowest levels in March 2020, as the impact of the COVID crisis unfolded, though rapid and impressive stimulus measures by policymakers halted the declines. In the US, yields slowly began to rise from early August, but since the beginning of this year, government bond yields have risen sharply around the globe in increasingly frenzied ‘reflation’ trades. The markets went into seizure late in February with an indiscriminate sell-off in global government bond markets.
Why? The assumption of higher inflation around the globe is mainly based on the massive fiscal stimulus in the US becoming even larger following the Biden presidency, with the engine of the US then lifting all other economies. Yet, other governments are not in a similar position; they are not providing stimulus on the same scale as the US and many of their central banks are unable to raise interest rates based on medium-term structural problems in their economies (eg, low wage inflation, lacklustre business investment). It is worth noting that between 2014‑18 it was only the US and Canada that actually managed to execute anything worth denoting as an interest rate hiking cycle, albeit far more modest that previous cycles.
A compounding factor in the February market sell-off was a lack of liquidity across government bond markets. Economists will explain that real yields rise due to growth and rate expectations but as market participants we know that low liquidity can be as important a factor. In a report released by the Bank of England on 26 March 2021, the bank staff mention the liquidity problems that were exacerbated in the sell‑off:
“… in February, the fragile nature of liquidity in some government bond markets had been evident during a period where advanced economy government bond yields had risen markedly. These increases in yields reflected improvements in the growth outlook, but they had been associated with some instances of illiquidity. During this episode, some measures of market functioning deteriorated”.
To illustrate, yields went into a spasm in the US on 25 February following poor demand at the auction of 7-year Treasury bonds, while 10‑year Australian government bond yields rose by around by 35 basis points (bp) or 0.35% in 24 hours (based on futures pricing) as investors rushed in to sell bonds but could not — even though the central bank had signalled that it had no intention of raising rates before 2024.
As always in bond markets, indiscriminate sell‑offs provide a good window of opportunity for an active manager to add risk to a portfolio. Given that we do not see a regime shift in inflation on the horizon, but more a return to the divergence in interest rates in the developed world that existed pre-COVID crisis, we took advantage of it by investing in gilts and Australian government bonds and switching some of our US exposure into Australian bonds. It is interesting to note that during the month of March, 10‑year yields in the UK and Australia stabilised while equivalent US bonds drifted 36bp higher. This is a more rational reflection of the interest rates in the respective economies.
The January effect
It is not uncommon in the first few weeks of the year to see excitement about growth and inflation in year‑ahead forecasts.
The chart in figure 1 shows Google searches for ‘reflation’, which seems to have reached new heights this year. The confluence of vaccines, prospects for reopening economies, US fiscal stimulus and the surge in commodity prices have combined to create one of the most powerful reflation narratives in recent market memory. However, we believe that the market has excessively focused on the short term; namely, the next couple of quarters of recovery.
Figure 1: Google searches for reflation
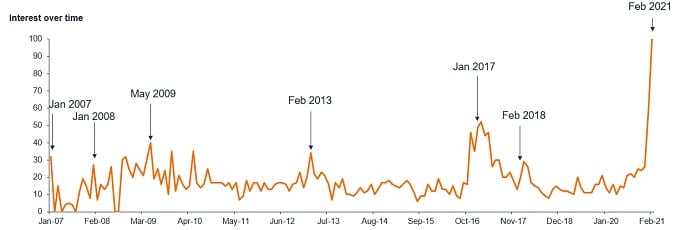
Source: Janus Henderson Investors, Google Trends, searches for ‘reflation’ on the web, worldwide, as at 24 February 2021.
Note: Interest over time numbers represent search interest relative to the highest point on the chart for the given region and time. A value of 100 is the peak popularity for the term. A value of 50 means that the term is half as popular. A score of 0 means there was not enough data for this term.
Of course, we expect to see an inflation bounce over the next few months; it is due to a mixture of base effects in headline inflation — as the low (and negative) oil prices of last year drop out of the 12‑month rolling calculation — and the reopening of the economies, which will see an initial burst in spending as people resume normal activities.
It is also not unusual to see inflation rise due to base effects following a recession; back in 2010‑11, inflation rose as high as 5.2% in the UK, c.4% in the US and c.3% in Europe; hence why central banks are signalling that they would look past the short‑term rise. However, market expectations of inflation based on Bloomberg market forecasts are also signalling a peak of around 3.5% in the US (headline inflation), falling to 2.5% by the year end. The figures for Europe and the UK (retail price index) are 1.5% and 2.5%, respectively (data as at 13 April 2021).
Rate of change of economic data is important
Bond yields follow the rate of change in growth and inflation in the economy
We use a simple proprietary model that looks at the rate of change in economic data and compares it to the level of government bond yields for the developed markets. Figure 2 shows the model’s analysis for the US versus 10‑year Treasury yields.
Figure 2: rate of change in US economic data vs 10‑year Treasury
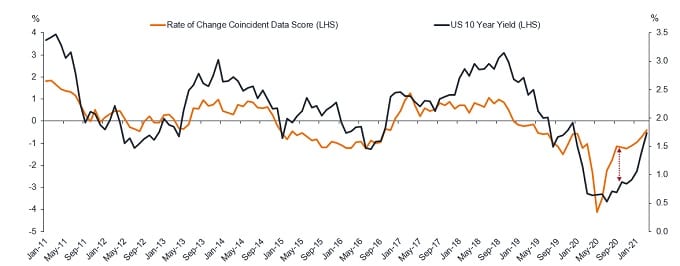
Source: Janus Henderson Investors , as at 31 March 2021.
Note: Rate of change, growth and inflation data, year-on-year. For illustrative purposes only.
Back in the summer, we thought that bond yields looked artificially low relative to the recovery in the data — subsequent rising yields proved the case. The bounce up in recovery that we are going to see is predictable from the model too, on base effects from comparable data back in March and April 2020, and the negative and low oil prices last year. The rate of change of data (or the recovery in data) looks to peak around May and our initial read on the third quarter base effects in the US suggests that this model will predict yields falling to circa 1% (very difficult base effects from Q3 2020 in the US). Needless to say, we do not mindlessly follow models but this is sufficiently interesting to be worthy of note.
Where is China?
In the last decade or more, China has been key in reflating the global economy. The country’s growth policies led to strong demand for imports of vast quantities of raw materials, helping to prop up commodity prices. Figure 3 charts China’s credit impulse (in very loose terms, the flow of credit) over time. Three phases can be seen here, with the most recent clearly weaker than the previous ones.
Figure 3: China’s diminished credit impulse
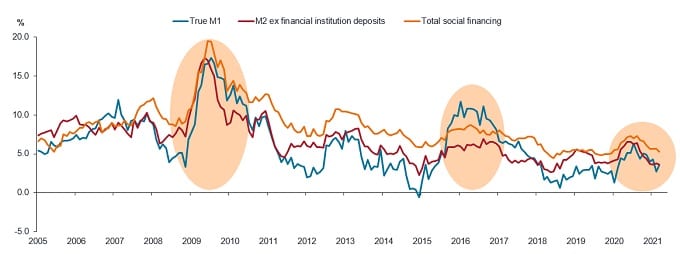
Source: Janus Henderson Investors, Simon Ward Economic Adviser, Refinitiv Datastream, as at 31 March 2021.
Note: True M1 is a narrow measure of the stock of money comprising currency in circulation and demand deposits. M2 also includes time deposits. Total social financing is a broad measure of credit and includes bank lending and local government/corporate bond issuance, among other items.
While China has come out of the COVID crisis, its credit conditions are tight because the People’s Bank of China maintains its restrictive stance. The manufacturing recovery seems to have peaked and the country’s core inflation remains weak. China, it seems, has a different agenda this time with more focus on rebalancing the domestic economy. So, we are unlikely to get reflation through China. In fact, we believe that China will be an impediment to a sustainable and persistent rise in growth and inflation.
Behavioural changes
People typically spend a small portion of the wealth that they have accumulated. There is evidence that the private sector continues to save, while governments are spending. We wrote a tweet in late February, referencing the speech of a member of the Bank of England, where high earners in the UK were shown to have a propensity to save more than their lower income cohorts. Further evidence is shown in figure 4 — the contraction in bank lending in the US.
Figure 4: US bank lending still contracting
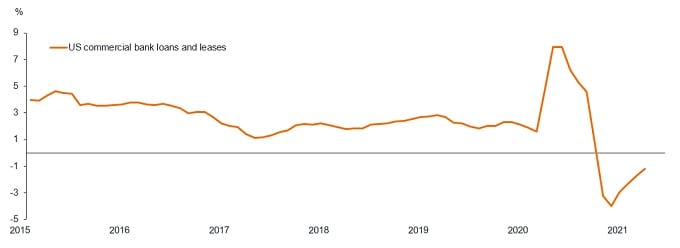
Source: Janus Henderson Investors, Simon Ward Economic Adviser, Refinitiv Datastream, as at 31 March 2021.
Note: US commercial bank loans and leases, rolling 6-month percentage.
Households are seemingly using stimulus checks to pay down debt and save cash (some of which will probably be spent as economies reopen). The contraction in industrial lending has been evident in the fourth quarter 2020 earnings reports across a number of US banks. For example, Bank of America reported a rise of 23% in deposits and a decline of 5% in lending.
Ultimately, the public sector (government) does not create inflation, it is the private sector that creates it through borrowing and lending in the economy. The lack of demand for credit is, in our view, disinflationary in the long term. There is a change in behaviours, which will not be affected by a short bout of spending post COVID, as the doors to the economies open once more. In fact, based on this evidence, we believe that the predicted surge in spending could disappoint.
Let’s not forget the fiscal cliff
It is fair to assume that the massive fiscal stimulus in the US is unlikely to be repeated next year (sadly, no more $1,200 cheques!). It involves a bit of mathematical analysis, but a one-time fiscal easing, while acting as a tailwind for growth this year, will turn into an equal and offsetting drag next year. The effect on inflation is similarly transitory, as the gap between supply and demand turns positive during the period of strong growth, pushing inflation higher, but the fiscal drag in the following year is likely to lead to a slowdown in growth and reverse the inflationary impulse. Figure 5 is a good depiction of fiscal boost/fiscal cliff in the US.
Figure 5: US — fiscal boost followed by fiscal cliff
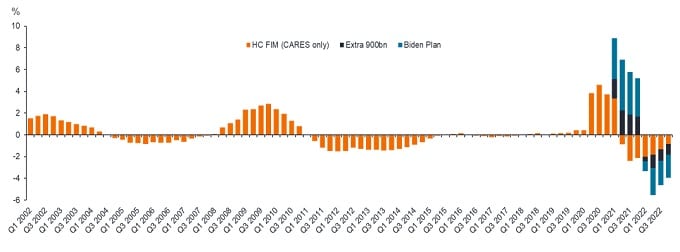
Source: Absolute Strategy Research Limited, as at 1 February 2021.
Note: HC FIM = Hutchins Centre Fiscal Impact Measure; shows how much local, state and federal tax and spending policy add to, or subtract, from overall economic growth, and provides a near-term forecast of fiscal policies’ effects on economic activity. CARES = The US Coronavirus Aid, Relief, and Economic Security Act, also known as the CARES Act.
A lot of the cyclical inflation has been priced in
We believe that a lot of this cyclical inflation outlook has already been priced since last summer.
Using the 10‑year US Treasury as an example, decomposing its yield into inflation expectations and the interest rate component, it can be seen that both are nearing what would be thought of as their normal valuations. 10‑year US Treasury yields have risen from around 0.50% in early August to around 1.67% at the time of writing (13 April 2021).
Evidence on inflation expectations comes from the 10‑year breakevens rate (a proxy for investors’ expectation on inflation), which are now higher than the 2.2% peak seen in 2018 — ie, the levels are at cyclical highs. While another measure, a proxy for where markets believe interest rates will peak (once they start rising)¹ is around 2.4% currently (as at 13 April 2021) — note that US rates peaked at 2.5% in the last rate hiking cycle. Thus, unless one believes that the Fed is going to raise rates much more quickly than signalled, which we are not convinced it will do given current levels of unemployment, then a good deal of inflation and rate rises have already been priced into bond valuations.
Conclusion
We do not see a regime shift in inflation going forward and the indiscriminate sell‑off in February, while a shock to the system, was also an opportunity to invest in select bond markets.
We have long framed the predictable rise in government bond yields in the first quarter of 2021 as a cyclical opportunity to add duration to a portfolio and hence move from a credit sensitive, short duration position (early cycle positioning) to a more duration sensitive core bond portfolio. As ever with a reflation trade, US government bonds are at the epicentre of the sell-off as this is one of the few bond markets in the developed world where a credible case can be made and priced for multiple rate rises. This has now occurred and the profile of data over the next few months will dictate whether the high in yields for even this economy are in.
1The proxy used is the 5‑year/5‑year forward interest rate; ie, five year yields, starting in five years’ time. Essentially a proxy for where markets think interest rates may peak once a hiking cycle begins.
Glossary
Basis point: one hundredth of one percent or 0.01%.
Bond yield: the level of income on a security, typically expressed as a percentage rate. Note, lower bond yields mean higher prices and vice versa.
Bond vigilantes: refers to bond market investors who oppose monetary or fiscal policies considered inflationary by selling bonds, thus raising their yields. The term was introduced by former EF Hutton economist Edward Yardeni in the early 1980s to describe how bond sell-offs could force the hand of central banks or governments.
Breakeven inflation rate: the breakeven inflation rate represents a measure of expected inflation derived from the yields of nominal and inflation linked bonds. The value implies what market participants expect inflation to be in the next 10 years, on average.
Cyclical: asset performance is often driven largely by cyclical factors tied to the state of the economy. Economies and markets are cyclical and the cycles can last from a few years to nearly a decade. Generally speaking, early cycle is when the economy transitions from recession to recovery; mid‑cycle is when recovery picks up speed while in the late‑cycle excesses typically start to build, growth slows, wages start to rise and inflation begins to pick up.
Duration: how far a fixed income security or portfolio is sensitive to a change in interest rates, measured in terms of the weighted average of all the security/portfolio’s remaining cash flows (both coupons and principal). It is expressed as a number of years. The larger the figure, the more sensitive it is to a movement in interest rates.
Fiscal stimulus: a government policy relating to setting tax rates and spending levels. Fiscal stimulus (to boost the economy) refers to an increase in government spending and/or a reduction in taxes.
Liquidity: The ability to buy or sell a particular security or asset in the market. Assets that can be easily traded in the market (without causing a major price move) are referred to as ‘liquid’.
Real yield: nominal bond yields less inflation. ‘Real yield’ is the part of a bond’s nominal yield that can be thought of as driving financial conditions. It is made up of several moving parts including rate hike and growth expectations. Real yields are basically equivalent to the cost of capital and affect liquidity conditions for many asset classes.
Reflation: here referring to an upswing of the economic cycle where both growth and inflation are accelerating, usually (but not always) following a deflationary period (such as the one experienced in the COVID crisis) or a recession. It is not the same as ‘inflation’, which deals with the rising prices of goods and services.
Structural change: a dramatic shift in the way an industry or market functions, usually brought on by major economic developments; eg, advances in technology.
These are the views of the author at the time of publication and may differ from the views of other individuals/teams at Janus Henderson Investors. Any securities, funds, sectors and indices mentioned within this article do not constitute or form part of any offer or solicitation to buy or sell them.
Past performance is not a guide to future performance. The value of an investment and the income from it can fall as well as rise and you may not get back the amount originally invested.
The information in this article does not qualify as an investment recommendation.
For promotional purposes.