"With these two charts, you can see how unusual the current decline in interest rates is, pushing yields down to levels that hadn’t been reached during the past seven centuries."
Dr. Brian Taylor
Global Financial Data, 3 March 2019
Global Financial Data has collected centuries of data on interest rates. We wanted to highlight two data sets from the GFD Indices that cover government bond yields from 1285 to 2019 and that cover central bank deposit rates from 1522 until 2019. With these two charts, you can see how unusual the current decline in interest rates is, pushing yields down to levels that hadn’t been reached during the past seven centuries.
Government Bonds
Figure 1 provides data on the yields on government bonds from 1285 until 2019. During the past 700 years, the financial center of the world has passed from Italy to the Netherlands to England to the United States. We have used data from each of these countries to create the graph provided below. Data includes the Prestiti of Venice from 1285 to 1303 and from 1408 to 1500, the Consolidated Bonds of Genoa from 1304 to 1408, the Juros of Spain from 1504 to 1518, Juros of Italy from 1520 to 1598, government bonds of the Netherlands from 1606 to 1699, English bonds, primarily the British Consol from 1700 to 1918 and United States 10-year bonds from 1918 to 2018.
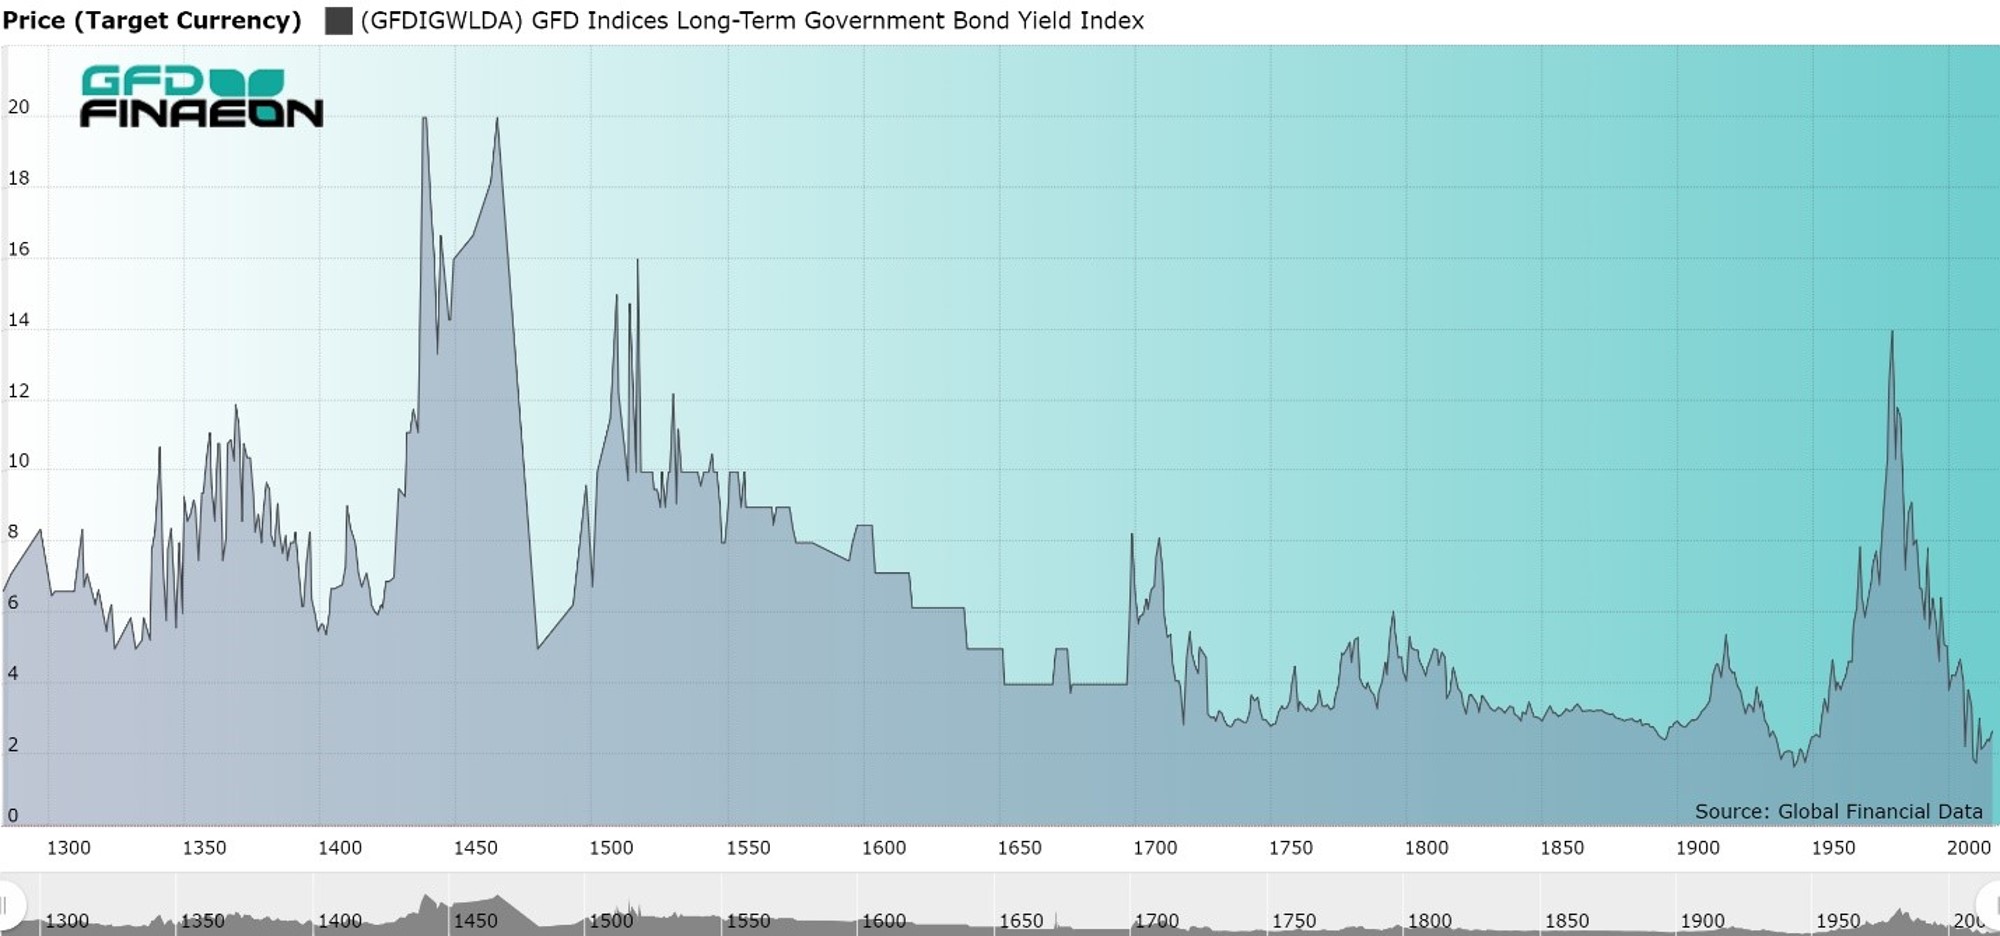
The general trend in yields has been for rates to decline over the past 700 years, especially since 1550. Before then, yields often spiked when wars in Italy and elsewhere put the payment of interest and the redemption of the bonds at risk. Under normal circumstances, bonds would yield about 6%, but in two cases, failure to pay interest on outstanding bonds pushed yields up to almost 20% before the end of the wars eliminated the possibility of further default.
Since 1600, when Dutch bonds were substituted from Italian bonds, the risk of default has been virtually eliminated driving yields down from 6% in 1600 to close to zero today. In fact, many European and Japanese government bonds pay a negative yield. Since there is little risk of default, increases and decreases in yields have primarily been driven by inflation during the past three centuries, which explains both the rise in interest rates around World War I and between 1950 and 1980. As long as central banks can control inflation, government bond interest rates are likely to remain low for some time to come.
Central Bank Rates
Using treasury bills as a short-term alternative to cash began primarily during World War I. Consequently, treasury bills cannot be used to provide a long-term chart of interest rates; however, the interest rate central banks pay on deposits provide centuries of data.
Figure 2 provides a graph of interest rates over the past 500 years. The graph uses the deposit rate of the Bank of St. George in Genoa from 1522 to 1625, the legal limit on English loans from 1625 to 1692, the deposit rate for the Bank of England from 1693 to 1913, the Discount Rate of the Federal Reserve Bank of New York from 1913 to 2002 and the Federal Funds Target Rate since 2003.
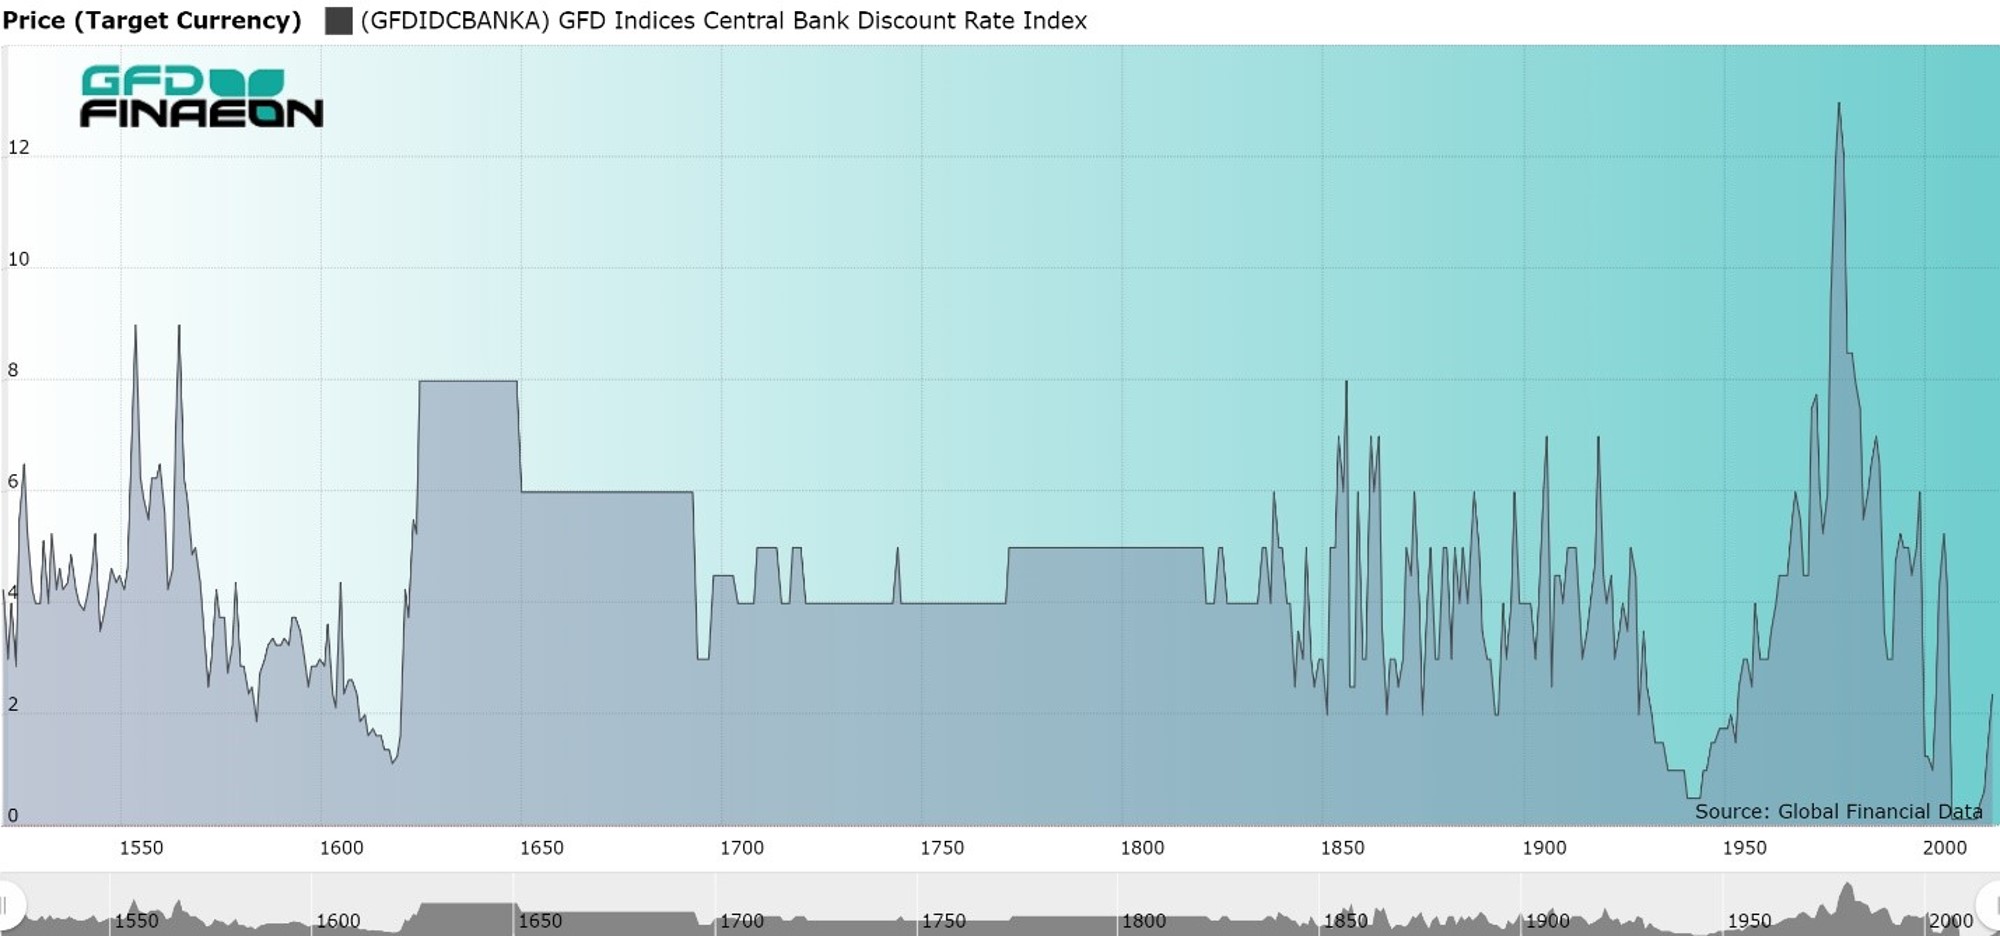
As the graph shows, the deposit rate has fluctuated between 2% and 4% during the past 500 years. There were periods, such as the early 1600s, during World War II and during the past 10 years when interest rates fell below 2%, but these were exceptions to the rule. The highest short-term interest rates occurred in 1981 when inflation drove interest rates to double-digit levels for the first time in history. On the other hand, the Great Recession after 2008 drove interest rates to negative levels in Japan and Europe and almost to zero in the United States. These are truly unprecedented times.
Conclusion
This blog has provided over 700 years of history on bond yields and deposit rates in Europe and the United States. During the past seven centuries, the center of the financial world passed from Italy to the Netherlands to England and to the United States. We have used yields from each of these countries to put together these long-term charts. Both short-term and long-term yields today are driven by inflation rather than risk, and as long as inflation remains low, yields are likely to remain low for some time to come.