US narrow money M1 has surged since the elections. The stock of M1 jumped by 14.1% between the weeks ending 16 November and 30 November, a larger two-week rise than occurred in March / April in response to Fed easing.
Simon Ward, Economic Adviser
Janus Henderson Investors, Global Perspectives, December 2020
US narrow money M1 has surged since the elections. The stock of M1 jumped by 14.1% between the weeks ending 16 November and 30 November, a larger two-week rise than occurred in March / April in response to Fed easing – see chart.
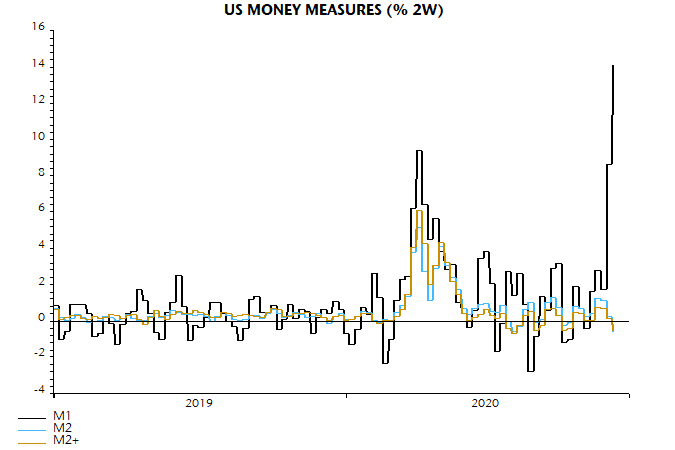
Broader money measures, however, have been unmoved – in contrast to the spring, when they also surged. M2 fell by 0.6% between the same two weeks, as did a broader aggregate including large time deposits and institutional money funds (“M2+”).
What’s going on? Data on money stock components show a large increase in demand deposits – included in all the money measures – offset by a fall in savings deposits, which feature only in the broader aggregates.
One possible explanation is that households and firms are mobilising precautionary balances accumulated as a hedge against a chaotic election outcome. Money could be shifting from inactive, “low velocity” savings accounts to “high velocity” demand deposits, prior to its deployment in the economy and markets. This would be extremely bullish for activity and equities.
An alternative technical explanation, however, is more likely. The Fed in April removed a six-per-month limit on transfers from savings accounts. This change has implications for the way banks report their deposits on the FR2900 form that feeds into the monetary data. Banks were asked to continue to report such accounts as savings deposits if they retained the right to request advanced written notice of withdrawal. Where this right was removed in addition to the six-per-month limit, however, the Fed advice was to report the account as a transactions deposit, i.e. as a demand deposit or under the “other checkable” category (depending on further conditions). “Other checkable” deposits, which are included in M1, also rose sharply in the latest two weeks.
The H.6 money stock release contains no warning of any distortion to the M1 data but it is likely that one or more large commercial banks reclassified a bloc or blocs of savings accounts as transactions deposits in the latest fortnight, causing them to move into M1 from the non-M1 portion of M2.
This explanation is supported by the observation that savings deposits at thrift institutions – accounting for only 11% of total savings deposits – rose in the latest two weeks, in contrast to the huge fall in such deposits at commercial banks.
Assuming that this explanation is correct, it is unclear why there has been a seven month interval between the April rule change and the reclassification, or why several banks may have made the change simultaneously.
A message has been submitted to the Fed’s statistical department requesting clarification of the above points and any response will be reported here. In the meantime, the M1 surge should probably be discounted.
These are the views of the author at the time of publication and may differ from the views of other individuals/teams at Janus Henderson Investors. Any securities, funds, sectors and indices mentioned within this article do not constitute or form part of any offer or solicitation to buy or sell them.
Past performance is not a guide to future performance. The value of an investment and the income from it can fall as well as rise and you may not get back the amount originally invested.
The information in this article does not qualify as an investment recommendation.
For promotional purposes.