The “quantity theory of wealth” described in the previous post rests on the following propositions:
1) The demand to hold (broad) money is a stable function of income (nominal GDP) and wealth (financial and tangible).
2) A persistent divergence between money demand and the actual stock of money causes changes in income and / or wealth to restore equilibrium.
3) To the extent the income response is small – as predicted by conventional economic models – asset prices / wealth will bear the burden of adjustment.
One implication of the “theory” is that the conventional measure of velocity (i.e. the ratio of income to the money stock) is misleading because it fails to account for the dependence of money demand on wealth as well as income. A fall in conventional velocity – often regarded as a “bearish” development by commentators – is associated with rising not falling wealth.
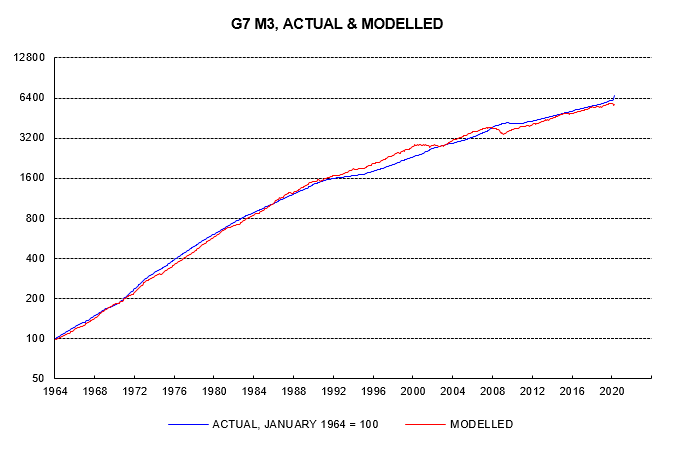
The previous post showed that G7 broad money demand can be adequately modelled by the simple equation
M = (PY)0.5W0.5/V* (1)
where PY = nominal GDP (P = prices, Y = real GDP), W = a wealth proxy encompassing equities, bonds and housing, and V* = “true” velocity, which is stationary / mean-reverting.
The first chart, reproduced from the previous post, compares the actual stock of money with modelled money demand since the 1960s. The second chart focuses on the last 15 years.
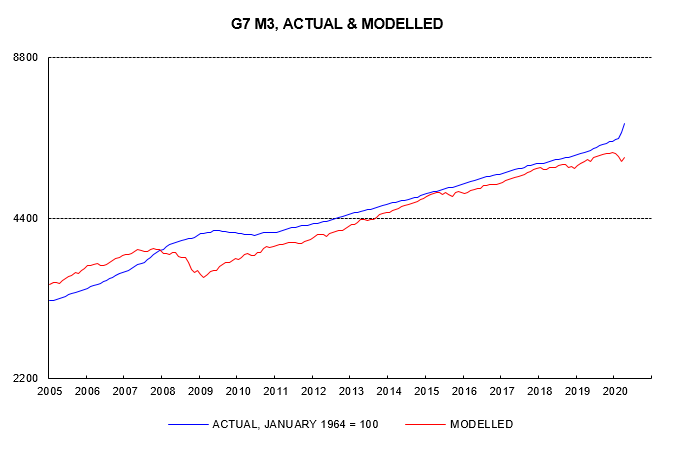
A large positive gap opened up between the actual money stock and money demand during the GFC. “Excess” money balances, on the view here, “caused” the subsequent recovery in economic activity and asset prices.
The gap narrowed significantly over 2009-15, after which it remained broadly stable at a modest level by historical standards until late 2019. The actual money stock was 4% above the modelled level in September 2019.
Growth of income and wealth in recent years has aligned with money growth: M3 rose by 4.7% per annum in the three years to September 2019 while the combined income / wealth measure on the right-hand side of equation (1) increased by 4.5% pa. Wealth outpaced nominal GDP, rising by 5.4% pa versus 3.6%.
Annual M3 growth firmed during 2019 and has surged this year, reaching an estimated 13% in April, the fastest since 1976. With lockdowns reducing GDP and equity prices weakening, the gap between the actual money stock and modelled money demand has ballooned to 15%, not far below a GFC peak of 19% reached in February 2009 just before equity markets bottomed.
A reasonable expectation is that the rise in the money gap from 4% to 15% will be reversed over the next 2-3 years. A fall requires some combination of monetary weakness, a rise in real GDP, higher prices of goods and services and an increase in wealth.
Monetary weakness contributed to the reduction of the gap after the GFC. G7 M3 rose by only 1.4% pa in the three years from February 2009. Similar sluggishness now is unlikely. Post-GFC weakness was driven by banks restricting lending to boost their capital ratios, as demanded by regulators. They are now being encouraged to extend credit to support the economy. QE is on a larger scale than then and is likely to be sustained while fiscal deficits remain wide. M3 growth may remain well above the 4.7% pa average over September 2016-September 2019.
A recovery in real GDP as health restrictions on economic activity are relaxed will make a small contribution to reducing the money gap. The current GDP undershoot (Q1 data) accounts for 2 percentage points of the rise in the gap from 4% to 15%.
This leaves 9 percentage points of the required adjustment from 15% to 4% to be borne by rises in goods and services prices and / or wealth. If the adjustment were shared equally between the two, equation (1) implies that both would need to increase by 9-10%.
G7 goods and services prices, as measured by the GDP deflator, rose by 1.6% pa in the three years to Q4 2019. A 9% boost over 3 years would imply a rise in inflation to 4-5% pa. The immediate impact of the crisis and an oil supply shock are suppressing inflation currently, suggesting an offsetting overshoot in 2021-22. A reasonable base case scenario, therefore, is that G7 inflation will rise above 5% in 2021-22.
Against this backdrop, a 9% boost to wealth would probably reflect increases in equity and / or house prices, with bond prices weakening.
Other scenarios can be considered sharing the burden of adjustment differently between the various factors. If "excess" money fails to lift asset prices / wealth, for example, the implication is an even stronger pick-up in goods and services inflation, to 7-8% pa. Conversely, continued low inflation would suggest an even more bullish outlook for asset markets.
These are the views of the author at the time of publication and may differ from the views of other individuals/teams at Janus Henderson Investors. Any securities, funds, sectors and indices mentioned within this article do not constitute or form part of any offer or solicitation to buy or sell them.
Past performance is not a guide to future performance. The value of an investment and the income from it can fall as well as rise and you may not get back the amount originally invested.
The information in this article does not qualify as an investment recommendation.
For promotional purposes.