
In Search of the GI & Infrastructure Bills of Tomorrow
You have left your home to serve your country.
Serve it to the credit of yourself, your family, your state and your country. You are now a comrade in the fraternity of American servicemen.
The American Legion, 1942
Though his landing craft had drifted about a mile from its intended landing point on Utah Beach on that fateful morning of June 6, 1944, Brigadier General Theodore Roosevelt Jr. was spitting hot ready for combat, which was saying something considering his first tour had be- gun in that same country 26 years earlier. This was to be Roosevelt’s fifth amphibious invasion. He had already seen action in North Africa, Sicily and the treacherous mountains of Italy. His superior officer, Major General Raymond “Tubby” Barton put his foot down, insisting the 56-year-old stand down on D-Day. To this, in a May 26, 1944 letter, Roosevelt beseeched im- plored he be cleared to once again stand among his men: “I personally know both officers and men of these advance units and believe that it will steady them to know that I am with them.”
With only cane and pistol in hand, upon landing, the former president’s oldest son and name- sake pronounced, “We’ll start the war from right here!” That he did alongside 23,250 who landed at Utah Beach on D-Day, many of whom were among more than 60,000 casualties in the first 30 days after the invasion. On the occasion of the 60th Anniversary of D-Day, the American Legion reported on one veteran’s reaction to seeing Omaha Beach after so much time had passed: with tears rolling down his cheeks, he admitted, “I don’t know how I made it...or why I made it.”
Weeks earlier, the National World War II Memorial had been dedicated in Washington, D.C. With 150,000 veterans there to honor the moment, the then-American Legion National Com- mander John Brieden explained that many in attendance felt that the monument was un- needed: “Veterans of World War II saw victory as reward enough – the freedom that emerged from their sacrifices, the prosperity of the 20th century, a world saved from dictatorship, imperialism, the Holocaust.”
Prosperity was not something WWII GIs took for granted. They had witnessed the other side of good fortune firsthand as no prior U.S. generation had. Many were the sons of those who had fought in World War I who’d been handed $60 and a train ticket home when the war ended in 1918. Not only did the federal government fail to show gratitude for the sacrifice and service of countless former soldiers who had great difficulty finding a job, within 11 years of returning home, the country was slammed into the Great Depression.
The return of millions of Veterans from World War II gave Congress a shot at redemption at the risk of repeating the sin of inaction so soon removed from economic peril. On June 22, 1944, President Franklin Delano Roosevelt signed into law the Servicemen’s Readjustment Act, which is more commonly known as the GI Bill of Rights. The legislation provided fund- ing for education and training, loan guaranties for homes, farms or businesses, and unem- ployment pay. The far-reaching implications of this bill were enormous. In 1990, President George H.W. Bush summed up the impact of the bill as such: “the GI Bill changed the lives of millions by replacing old roadblocks with paths of opportunity.” How true, how true. Per the U.S. Department of Veterans Affairs:
“Before the war, college and homeownership were, for the most part, unreachable dreams for the average American. Thanks to the GI Bill, millions who would have flooded the job market instead opted for education. In the peak year of 1947, Veterans accounted for 49 percent of college admissions. By the time the original GI Bill ended on July 25, 1956, 7.8 million of 16 million World War II Veterans had participated in an education or training program.
Millions also took advantage of the GI Bill’s home loan guaranty. From 1944 to 1952, VA backed nearly 2.4 million home loans for World War II Veterans.
While Veterans embraced the education and home loan benefits, few collected on one of the bill’s most controversial provisions—the unemployment pay. Less than 20 percent of funds set aside for this were used.”
“Less than 20 percent of funds set aside for this were used.” This last part bears repeating. I struggled mightily to put into words the mental metamorphosis of a child who had been born into the Roaring Twenties just to see his (from the perspective of a male fighting soldier) world melt into the Great Depression. What a mindset with which to be conscripted, as 61% of the 16 million who served were via the draft, into fighting for your country and its ideals. And yet these GIs, for “government issued,” earned their title as the “Greatest Generation” precisely because they fought selflessly, not for fame or recognition, but because, as Tom Brokaw wrote, “it was the right thing to do.”
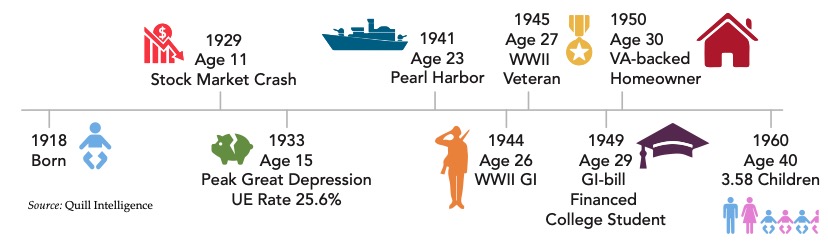
From Birth to Full House for a U.S. World War II GI
As contentious as the debate was in Congress in early 1944, what the politicians failed to realize was that such integrity would in the end leave 80% of allocated funding for unem- ployment untapped. To be paid to not work given the prospects afforded in the GI Bill would have been an insult to the recipients.
More than any time in U.S. history, our current politicians could learn a thing or two about presenting those who remain beaten down with “paths of opportunities” to attain dignity rather than being held down, which only perpetuates unrealized potential and cycles of pov- erty. The next few generations will, no doubt, need added, not depleted, earnings capacity.
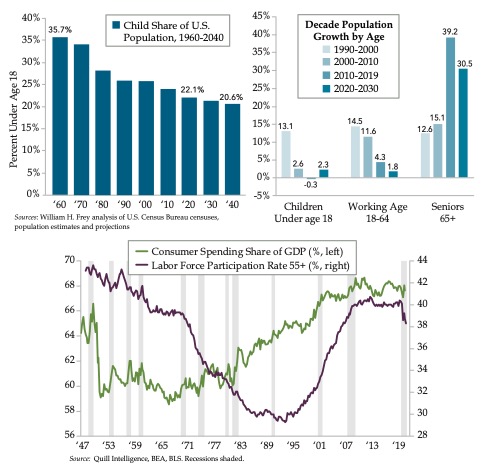
From the timeline above, you see that in 1960, the average U.S. family had 3.58 children. Since then, the U.S. fertility rate has crashed to a record low nearing 1.7 children. A recent Brookings report took the math one step further with an initial estimate that births in the 12 months following the coronavirus will be depressed by 300,000-500,000.
A Post-Baby Boom Birthrate Halved and Poised to Fall Further
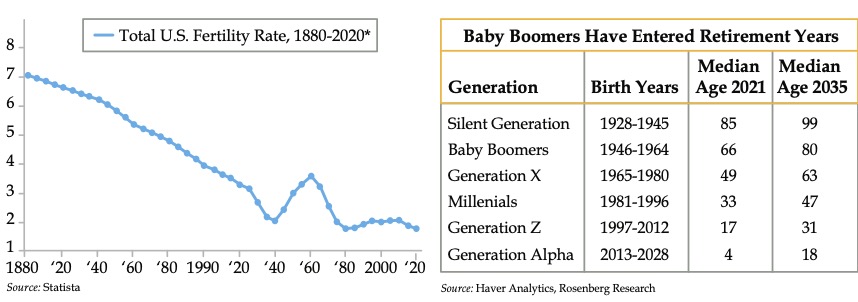
Steepening declines in the fertility rate will further exacerbate current estimates recently made by QI friend David Rosenberg. By 2035, when Baby Boomers median age is 80 and their ranks of retirees are being joined by my Generation X, the share of retirees in the population will exceed 21% while those considered to be working age fall to roughly 60% given the added effect of the pandemic. The upshot is America’s dependency ratio – the share of the very young and old to those in the workforce – will press past 80% from the current 71%.
Prosperity, meaning prosperity akin to that which came roaring out of the second world war, will be the key to the U.S. economy’s salvation given the current backdrop of markets that are priced to perfection alongside demographics set to exert a drag on aggregate economic output. Unfortunately, for the moment, the sole parallel that can be drawn between now and World War II, is the scope of fiscal spending. At its peak in 1945, deficit spending hit 37% of U.S. GDP. With a hat tip to Bloomberg’s Lisa Abramowicz, according to Cornerstone Macro, at $12.3 trillion in combined monetary and fiscal stimulus, current deficit spending has swelled to 57% of GDP, an unprecedented level in the country’s history.
Aside from juiced consumption and a factory sector jacked up by a three-year supply chain disruption, the most evident product of this exceptional fiscal spending is asset price valua- tions across the full spectrum of stocks, bonds and residential real estate.
-
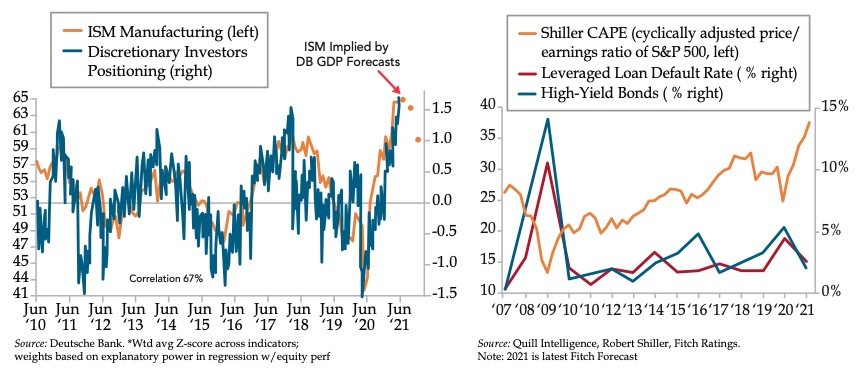
Shiller’s Cyclically Adjusted Price-to-Earnings (P/E) Ratio is 7.5 points north of its 1929 Black Tuesday high and 6.7 points shy of its December 1999 all-time high. With the sole exception of P/E ratios, every other stock market valuation metric has sur- passed its 2000 highs.
-
At 8%, borrowing costs for CCC-rated issuers, one rung above ‘D’ for default, are the lowest on record. Fitch, for its part has slashed its expected default rate to 2% for 2021, the lowest level since that infamous year of complacency – 2017.
-
In the last 12 months, home prices via Mortgage Bankers Association weekly pur- chase application data are up 27.5%, the highest since October 1991. For panicked buyers in need, there’s a veritable plethora of online literature available on how to win bidding wars.
We’ll get to housing and how its playing into the future of prosperity shortly. In the mean- time, observations that provide little in the way of timing guidance are of scant use to active investors. That’s why I hope you don’t see this next chart as a non sequitur. Investors are about as far out on the risk spectrum as they’ve ever been. They’ve breathlessly chased the reflation narrative which has been led by cyclical outperformance and validated by Federal Reserve officials who’ve vowed to not remove the punch bowl until 2023. Be that as it may, as depicted through the prism of the Institute for Supply Management’s manufacturing gauge, which is in the 95th percentile historically, investors are poised to turn tail, if you’ll indulge a technical term.
Stock and Bond Valuation Stretched to the Hilt and Investors Are All In
Few will weep for the wealthiest when risky assets correct. Come to think of it, many are like- ly to applaud. The same cannot be said of the nation’s less financially secure, especially those who are close to or already in retirement. Boomers’ median age of 66 suggests they will be hard-pressed to rejoin the workforce, especially if the unemployment benefits in place since April 2020 are allowed to expire on September 6th. With surreal headlines about McDonald’s paying would-be hires $50 just to show up for their job interviews, lobbyists are already out in full force campaigning to release the low-skilled laborers their firms desperately need to keep the lights on.
That can’t help the 68% of 2021 retirees who told European insurance giant Allianz that they’d had to retire earlier than they wanted, up from 50% in 2020. This post-pandemic trend towards forced retirement was validated by a Pew Research Center Survey which noted 3.2 million more boomers had retired in 2020 vs. 2019, up dramatically from the same delta in the prior year of 1.5 million.
Today’s retirees’ fate largely lies with where they worked followed by how well they planned for retirement. The luckiest of the bunch are the 7% cited by the National Institute on Re- tirement Savings (NIRS) who are covered by Social Security, a defined benefit and a defined contribution (401k) plan.
Though likely exaggerated given other sources of informal income, as in family members and side jobs, the NIRS found that as of 2020, four in ten older Americans relied solely on Social Security. A separate study, which is hopefully more accurate, found that half of U.S. retirees relied on Social Security for half of their income.
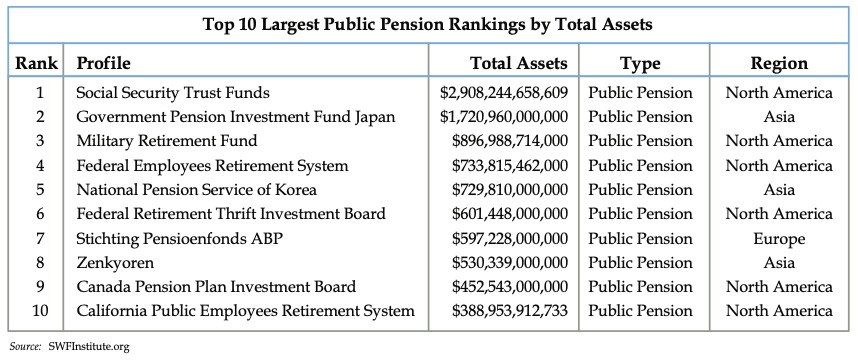
As you can see, at nearly $3 trillion, Social Security is by far the world’s largest pension fund scheme. That said, especially in the modern era, this source of retirement is not intended to be anything but a supplement to other sources. Social Security benefits typically replace 40% of income, a far cry from the 70% recommended to be set aside prior to waltzing off into one’s golden years. Making matters worse, what’s unfortunately most often the case is that those who need to wait the longest are the first to claim benefits. Roughly 60% claim their monthly payments before the mandatory year of 70; those who dip in the soonest, at age 62 leave a 75% boost to monthly payments on the table vis-à-vis those who can hold out the longest.
A fact of life is that those eight years are a luxury millions of U.S. retirees simply cannot afford. At the opposite end of the secure spectrum lie those covered by defined benefit plans, a.k.a. pensions, which cover roughly half of current retirees with the balance relying on (less reliable) 401ks. As defined benefits fade off the U.S. workplace landscape, roughly one in five current workers have that cover to look forward to in retirement; the percentage rises to 75% of public sector workers.
Public pensions, in particular, have been under a magnifying glass since the Great Financial Crisis (GFC). While there will be inevitable blow-ups in states such as Illinois, New Jersey, Connecticut and Kentucky, many states will be able to meet their obligations.*
The asterisk is that all bets are off for many more states if anything goes wrong with the stock and bond markets, commercial real estate and more recently residential as well. And then there is the increasingly relied-upon public pension fund asset class (to meet irrespon- sible return assumptions) known as “alternatives” – racy investments such as hedge funds and private equity that, in a majority of cases, are wholly inappropriate to say nothing of egregiously fee heavy. As long as all of those assets continue to rise, there will be no reckoning.
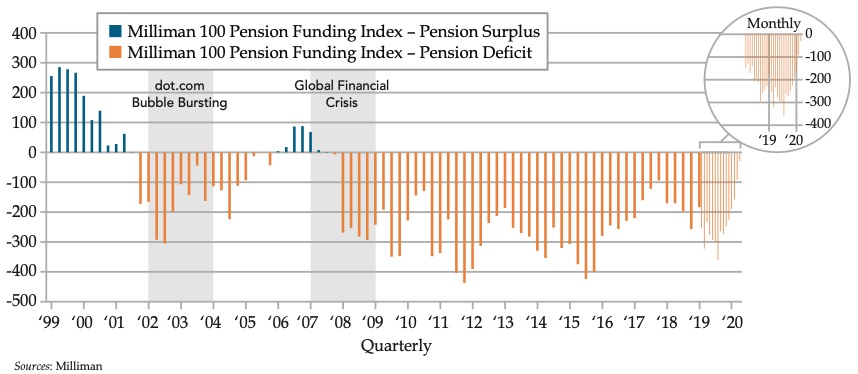
The “good” news is Jerome Powell was acutely aware of the bloodbath suffered by public pensions in 2020’s first quarter. Forestalling the political firestorm was one of the drivers of the Fed’s bailout of the financial markets including and especially alternatives. Indeed, after the orange line in the second panel briefly dipped, 2020 turned out to be a banner year of growth in the public pension arena.
For Now, Current Retirees Are Much Better Positioned if Covered by a Public Pension
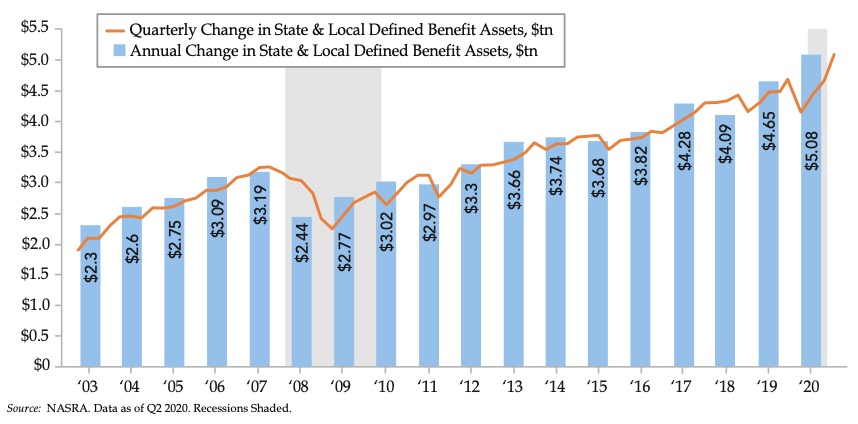
By far, the luckiest of all U.S. retirees – today assuming all continues to go swimmingly care of the Fed – are private pensioners. Per Milliman’s latest first quarter index, the 100 largest private defined benefit plans are 98.4% funded, the least underfunded since the years headed into the GFC. That compares with a 79% funded ratio for Milliman’s 100 largest public de- fined benefit plans. As a critical aside on the public pension front, the first quarter’s average fund return of 1.95% is a pittance of the roughly 7% most funds assume when calculating their liabilities.
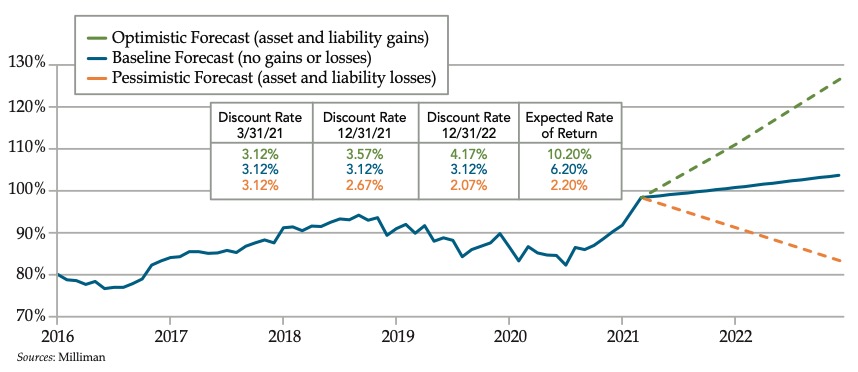
With apologies for the apples-to-oranges, private pensions’ median return expectation is 6.2%, an easier and more realistic bogey to hit. A worst-case scenario 2022 return of 2.2% would send private pension funding closer to 80%. Losses, you will note, are not even an option. For those of you who’d like to put the risk of pension fund exposure on your radar, the largest, in this order, are Boeing, AT&T, IBM, Raytheon Technologies, General Motors, Lockheed Martin, Kaiser and General Electric.
Private Pensions Reap the Benefits of the Fed Bailout
While healthcare consumes an increasing percentage of retirees’ incomes as they age, it is ir- relevant to the discussion of sources of retirement income. On that count, according to Boston College data, home equity accounts for 12% of the wealth of a household headed by those between the ages of 55 and 64. After Social Security and pensions, this source of wealth ranks third, larger than the median retirement account balance.
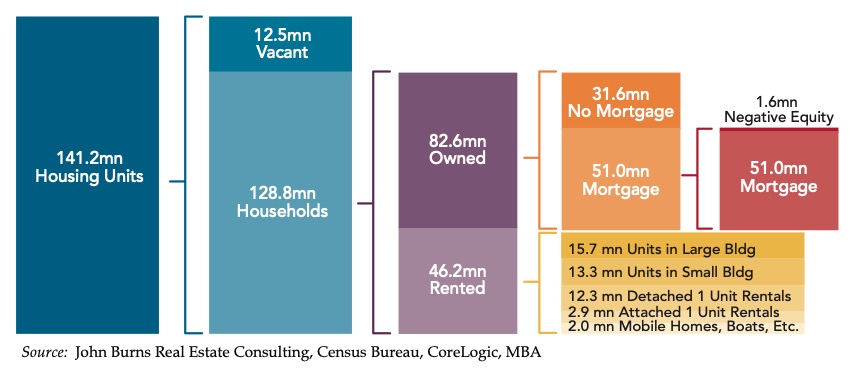
The key word, as it pertains to net worth, is equity in the home. Per the Bureau of Labor Statistics (BLS), roughly 80% of seniors are homeowners leaving the remaining fifth in the rental pool. As for outright ownership, 55% of seniors can make that claim which proffers such peace of mind. Across the demographic spectrum, there are 82.6 million U.S. households who own their home; within that pool, 31.6, or 38%, have no mortgage. It stands to reason that seniors would be disproportionately represented. It follows that seniors care much more than any other cohort about the prospects for home prices.
Nearly Four in Ten Own Their Homes Outright
It’s likely millions of seniors were contemplating listing their homes when the pandemic first hit, as soon as it was safe to do so. In the aftermath of the GFC, median home prices fell from roughly $240,000 to $214,000. Setting aside how surreal those prices are today given they’re closer to $350,000, most boomers do not own “median” homes but rather move-ups and McMansions, hence their home equity outweighing their IRAs and 401ks on their collective balance sheets.
But something happened on the way to phone the realtor. Or should it be said someone, as in Powell. As mentioned at the outset, year-over-year home purchase application price points are up neatly 30% as of the latest weekly data from the Mortgage Bankers Association (MBA). It’s little wonder that the MBA reports that in the refinancing orgy of the last year, those aged 55 and older accounted for almost half of the demand. Whether they were part of the resurgent army of cash-out refinancers is unknown. That said, we can report that Citi has pulled back from the home equity businesses. You can draw your own inferences on that one.
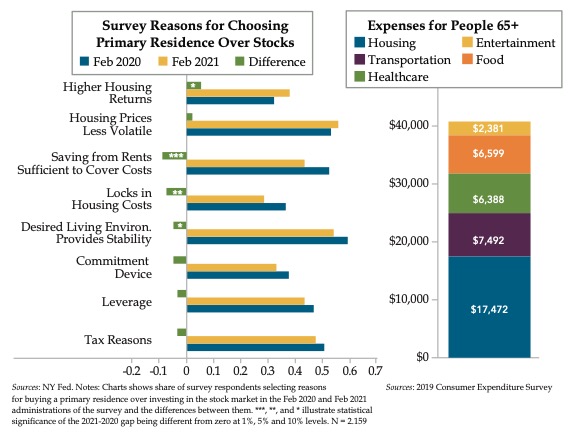
Broadening out to the entire universe of homeowners, among those with a preference for housing over stocks as holdings, the top two reasons as of this February were “Higher Hous- ing Returns” and “Housing Prices Less Volatile.” It’s too ironic for words that these insights emanate from a New York Fed survey, the former home to one Bill Dudley who notoriously directed homeowners to do their part to buttress the economy by cashing equity out of their homes to drive consumer spending. At least check, a home was something to be paid off that, in turn, acts as a stabilizing force once retirement years arrive and with them, a reduced and fixed income.
Of course, not all seniors are fortunate enough to own their own homes. Even for those who do, property taxes and maintenance are material expenses. Looking across the spectrum of buyers and renters, according to the 2019 BLS Consumer Expenditure Survey, the latest available, households led by those 65 and up spent an average of $17,500, about 35% of their annual budgets, on housing.
Housing: The Best “Investment” and Biggest Cost All in One
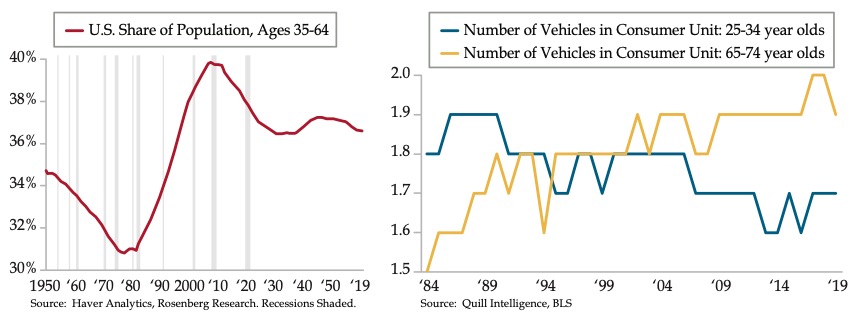
Whether a buyer or renter, one can only imagine how pre-pandemic retirees who moved to remote locales feel about being invaded by deep-pocketed expats who are driving up both home prices and rents. After housing, the second biggest budget line item is transportation. There’s little doubt seniors love their cars, almost as much as they love their big homes in which they hope to age in place. The right panel leaves little doubt that those aged 65-74 years drive more car than they did at the turn of the century. Did Greenspan’s igniting a housing bubble and the cash-out craze which ensued induced set off a trend towards greater drivership among house-rich seniors?
At the opposite end of the wheels spectrum sit the young Millennials, or should we say “Gen Uber.” To this hip set, the appeal of driving has waned over the same period as the advent of ride sharing and urban living weakened auto demand. We know that this age group has started to trickle back into cities. Perhaps they will help alleviate the used car shortage as they ditch their driving ways to fully transition back to city living. Looking into the future, the decline among those in their prime earnings years suggests a more general dissipation in demand for autos and SUVs. Tack on vehicles’ longer life expectancy and the outlook for sales is much less robust than today’s accepted wisdom concludes. Perhaps automakers should also pray to the home price gods to maintain showroom traffic from car-worshipping seniors.
Dwindling Prime Earners and a Cultural Shift Away from Driving Pose Threat to Vehicle Sales
By the middle of this century, those older than the age of 65 are expected to outrank the 18-and-under cohort. If that seems too far over the horizon to fathom, in the next nine years, seniors will grow by 30.5% -- 13 times the rate of children and 17 times faster than the working age population. Along with rising interest rates, most of today’s active investors have never had to concern themselves with demographics. It’s been a theoretical threat as worrisome as Fed officials allowing for price discovery.
There’s a reason for that, which is also attributable to the last time the Fed looked straight through a stock market bubble on par with that of today. In the mid-90s as lengthening lifes- pans opened the door to prolonged careers alongside the decline in public pensions, which compelled workers to save longer for retirement, the Labor Force Participation Rate (LFPR) among those ages 55 and older started to rise off its floor. And then came the dotcom bust, when stocks were so overvalued and speculation so arrogant, prices imploded under their weight. As you see, the 55-plus LFPR went parabolic as droves of premature retirees re-joined the workforce to recoup what had been lost in their IRAs and 401ks.
Seniors’ Growth Drives Demographics and Will Temper Consumption
Until the pandemic, seniors’ participation in the job market looked to be static at the highest levels since the Vietnam War. As foreign a concept as it might seem, it might be time we start to look at alternative means to generate economic output to offset boomers’ spending. True infrastructure and IT spending with an eye to competing with China would be a great step one. Genuine education reform to ensure only advocates for the students are in the classroom would be an even better step two. Granted, these impossible dreams might require imposing term limits on a legislature that must be dynamic to make forward progress. But that’s why the United States has a Constitution that can be amended by the people and thereby for the people.
We may as well throw in the towel if what I’ve just written is convicted as inconceivable before being tested on those among us who’d prefer to not pervert the American work ethic that made this country great. If you’ve any doubt, make it a mission to seek out one of the 300,000 World War II veterans still with us. It is their sense of pride in country that must be recaptured to put the U.S. economy once more on an aggressive enough pathway to growth to maintain the superpower status that was so hard fought.
See this website for more information:
https://www.nationalww2museum.org/war/wwii-veteran-statistics
On July 12, 1944, Brigadier General Roosevelt died of a massive heart attack five weeks after intrepidly leading the charge invading France. The following day at what was then known as Jayhawk Cemetery, his funeral was attended by 10 generals including George Patton and Omar Bradley. Roosevelt’s calm and unfaltering leadership helped rapidly move frightened young men off the beachhead and safely inland, saving countless lives. He was posthumously awarded the Medal of Honor and is buried in what is today Normandy American Cemetery and Memorial. Such was the veneration for the hero, his brother, Quentin, who was killed in World War I, was moved to rest forevermore beside him and remains the only Great War soldier buried beneath that most hallowed ground.
Befittingly a St. Patrick’s Day in New York, some 39 years earlier on March 17, 1905, the war heroes’ father, who was a sitting president at the time, walked a young Eleanor down the aisle. It was said that Teddy doted on his niece. Before leaving the reception, he was asked by the media of his thoughts on the Roosevelt-Roosevelt union. To that, he quipped, “It’s a good thing to keep the name in the family.”
History has always looked kindly on the union given First Lady Roosevelt’s tireless efforts to safeguard human rights. We are equally thankful that she always had her husband’s ear. She would have to have been an advocate of the GI Bill and its mission to raise up those who had sacrificed the most for the betterment of the country. Today, it’s with great hope that we look back on the GI Bill and the true infrastructure legislation that preceded it, both of which FDR signed into law. Would it be that our future leaders were similarly gifted with such vision.
The data, analysis, and other content contained in our Research and Site are provided "as is" and “as available.” Neither Quill nor any third-party data provider shall have any liability for any loss sustained by anyone who has relied on the information contained in any Research. QUILL DISCLAIMS ANY AND ALL EXPRESS OR IM- PLIED WARRANTIES, INCLUDING, BUT NOT LIMITED TO, ANY WARRANTIES OF MERCHANTABILITY, SUITABILITY OR FITNESS FOR A PARTICULAR PURPOSE OR USE, INCLUDING REGARDING THE ACCU- RACY, TIMELINESS, VALIDITY OR COMPLETENESS OF THE INFORMATION. Quill's past recommendations and model results are not a guarantee of future results. You agree that using any of Quill’s publications, services, products, software and content is entirely at your own risk.
The Research reflects facts, data, and our opinions as of the date each communication and may not be a complete description of any investment product, service, or strategy, and will not necessarily be updated as views or infor- mation change. We may have long or short positions in the securities discussed in our Research and may purchase or sell such securities without notice and inconsistent with views and opinions reflected in our Research. Using any graph, chart, formula or other device to assist in deciding which securities to trade or when to trade them presents many difficulties and their effectiveness has significant limitations, including that prior patterns may not repeat themselves continuously or on any particular occasion. In addition, market participants using such devices can impact the market in a way that changes the effectiveness of such device.
Other important disclaimers and disclosures are in your subscription agreement and HERE. Unless agreed other- wise in writing, all disclaimers are binding.
© Quill Intelligence
Quill Intelligence
intel@quillintelligence.com