Executive Summary
Total U.S. output remains about 3.5% below where it stood in the fourth quarter of last year. Our latest forecast has GDP getting back to its pre-virus peak in the second half of 2021, but the depth of the shock COVID has imparted on the U.S. economy suggests there could be a long-lasting downshift in potential output. In fact, an output gap has already started to form with the level of GDP lower than what would have been possible in the absence of the pandemic. Whether or not this gap closes or widens will depend on the extent to which COVID has permanently altered the economy’s potential growth rate.
In this report, we discuss the long-lasting effects on the economy from the 2007-09 recession. We acknowledge how the pandemic could also leave its mark on the U.S. economy, and highlight the need for monetary and fiscal policymakers to be aware of a downshift in potential output when calibrating policy. Lastly, we discuss possible implications of accommodative policy.
Potential Growth in the Post-COVID Era
COVID and related lockdown measures have had a clear impact on economic growth over the past three quarters. Less clear, however, will be the virus-driven downturn’s effect on the country’s potential growth rate, or the maximum sustainable rate at which the economy can expand based on its fundamentals. There are many factors considered in an economy’s potential growth rate such as labor force participation, productivity and population. For the United States, the potential growth rate is usually estimated to be around an annualized rate of 1.8%.1
Of course, the economy does not always grow at its potential growth rate. In the most recent expansion, there were plenty of events that pushed growth above (tax cuts) or below (trade wars) its potential from one quarter to the next. Growth also strays from its potential during recessions, as the economy contracts and then bounces back. While recessions can just be temporary deviations, evidence from the Great Recession suggests that severe recessions have the potential to shift economies’ long-term trajectory.2
We previously estimated the economic cost from the 2007-09 recession on nine major macroeconomic variables.3 By utilizing the pre-recession potential level of each variable, we were able to estimate the average annual reduction in the level of each variable during the 2008-15 period.4 To estimate the cost of recession using GDP, we estimated the pre-recession potential GDP level using the expansion phase growth rates, assuming no recession in the near-term, then estimated the potential GDP level using growth rates that included the recession and early years of expansion. The gap between these two levels is utilized as a benchmark to estimate the cost of recession (Figure 1).
The results showed a reduction across the nine variables, with an average annual reduction in the level of real GDP of 9.9% and 9.8% for personal consumption expenditures.5 This suggests the damages from the 2007-09 recession were long lasting, leading to a continued reduction in output long after the recession had passed. Further, the trend in terms of each variable’s actual level and potential level shifted down after the shock and resulted in a slow economic recovery.
Figure 1
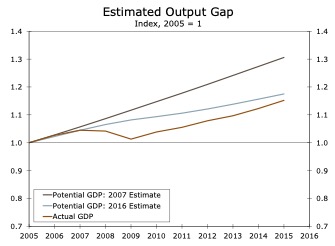
Figure 2
Source: U.S. Department of Commerce, Congressional Budget Office and Wells Fargo Securities
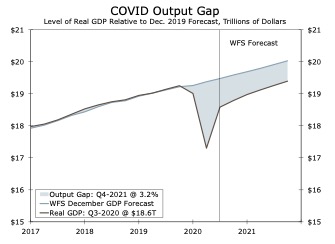
After the historic COVID-related swings in GDP growth, the level of real GDP remains about 3.5% below its pre-virus Q4-2019 level. Even when the virus is in the rearview mirror, it still may be a few quarters before GDP gets back to a ‘normal’ level. We currently estimate the level of real GDP won’t return to its pre-virus peak until the third quarter of next year. Further, the 2007-09 recession experience emphasizes that there may be long-lasting effects on output from the virus shock, and one way we may be able to calculate the true COVID effect on the economy will be to compare pre and post-COVID era potential GDP.
Given the size of the shock and accompanying contraction, we would expect to see some downward shift in potential output. As demonstrated in Figure 2, an output gap has already started to form. While it does not show the full cost of the recession, it illustrates the gap between our current trajectory and the path of the economy absent the pandemic. Whether or not this gap closes or widens will depend on the extent to which COVID has permanently altered the economy’s potential growth rate.
It is important for policymakers to understand if the economy’s potential run rate has fallen, as they often calibrate policy based on where the economy stands relative to its long-run baseline. For example, in 2018 Federal Reserve Chair Jerome Powell highlighted the importance of the natural unemployment rate and potential output for decision making, while discussing the uncertainty around existing estimates.6 An accurate measure of the natural unemployment rate is vital to monetary policymakers to select an appropriate policy stance. If the unemployment rate is above the projected natural rate, the FOMC would provide accommodation to stimulate the economy in an attempt to tighten the labor market, all else equal. Thus, it is important for the policymaker’s reference to be accurate to implement the correct policy stance.
Policy in the Post-COVID Era
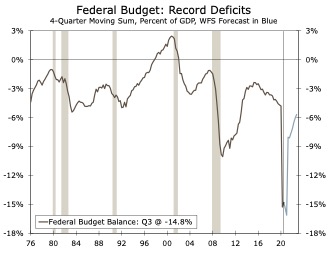
Monetary and fiscal policymakers have been busy trying to mitigate the economic impact of the pandemic. At the onset of the crisis, the FOMC slashed the federal funds rate to zero, increased asset purchases (Figure 3) and established or re-established several emergency lending facilities to promote smooth market functioning. The fiscal response has also been quite large and caused the federal budget deficit as a percent of GDP to reach levels not seen since WWII (Figure 4). This flurry of policy steps and questions surrounding further actions sent the economic policy uncertainty index soaring. Since the last COVID-relief package was passed, we have been skeptical of another large relief bill. With the election now behind us, it remains unclear whether more stimulus will come to pass in the coming months. Even without additional spending, however, the surge of government support through the spring and summer has illustrated the government’s willingness to stimulate the economy in the face of a crisis.
Figure 3
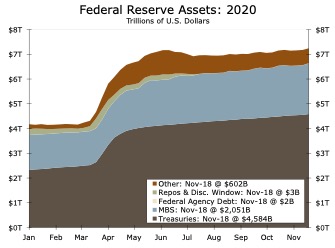
Figure 4
Source: Federal Reserve Board, U.S. Department of Treasury and Wells Fargo Securities
Monetary and fiscal policymakers typically provide accommodative policies during a recession, and accommodation is subsequently withdrawn as the economy stabilizes. But, there is almost no limit on how long policy can remain accommodative. For example, after the 2007-09 recession, monetary policymakers kept the federal funds rate lower for longer and it was not until 2015, or six years after the recession ended, that they raised rates for the first time. We expect a similar outturn today for two major reasons. First, given our expectation for inflation to remain below the Fed’s 2% target and the labor market recovery to take some time, we expect it will be a while until the FOMC deems tightening necessary. Second, as potential output and employment may shift downward it could cause the economy to grow in a lower gear. The post-Great Recession years are widely considered the weakest recovery in the post-WWII era.
Wealth Inequality in the Post- COVID Era
Accommodative policy for longer in the wake of the 2007-09 recession sparked concern that easy monetary policy was fueling the rise in equity prices and thus adding to income inequality. Concerns have come back to center-stage today, as the gap between wealthier and poorer households has seldom been larger.
The shock the pandemic has imparted on the U.S. economy has disproportionately affected poorer households. Job losses have been concentrated in lower-pay industries, leaving those least able to afford to lose a paycheck the most exposed. Ample fiscal support, most notably under the CARES Act, helped shore up lost income during the crisis. But as this stimulus is fading, many unemployed workers are left with minimal options for a source of primary income with latest estimates pointing to roughly two unemployed workers for every one job opening. The renewed pick-up in cases and restrictions to curb the spread of the virus further dim the prospects for a continued robust labor market recovery. Unemployment and the collection of jobless benefits remains the stark reality for millions of Americans, but at the same time, equity prices have already began to notch all-time record highs.
At the onset of the COVID-crisis in March, financial conditions tightened sharply with the Bloomberg financial conditions index sliding to its lowest level since the Global Financial Crisis (Figure 7). Conditions have since eased as a result of accommodative monetary policy, which has in part led to a rebound in financial markets with equity prices notching fresh all-time highs.
Figure 5
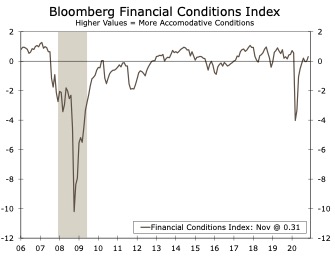
Figure 6
Source: Bloomberg LP, Federal Reserve Board and Wells Fargo Securities
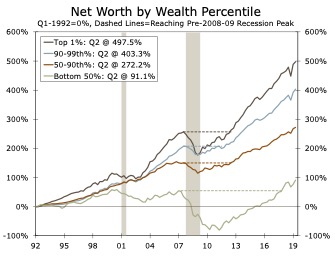
Although higher equity prices lift overall U.S. household net worth, they disproportionately benefit wealthier households. Corporate equities and mutual funds represent 40.1% of the top 1% of U.S. households assets, but only a mere 2.2% of the bottom 50%.7 Assets of the bottom 50% are concentrated in real estate (51.2%) and consumer durables (19.2%). It wasn’t until 2018, or eleven years into the post-Global Financial Crisis recovery, that the bottom 50% of households’ net worth surpassed its pre-recession peak (Figure 8). That compares to wealthier households seeing their net worth recover by 2012.
The accommodation the Fed has provided has been vital in supporting the economy through the crisis and ensuring smooth market functioning. FOMC Chair Powell has acknowledged the concern that the current downturn is going to fall hardest on workers least able to absorb it—toward the lower-end of the income spectrum—in some of his recent comments. It is important for both monetary and fiscal policymakers to address the likelihood of the unintended circumstances of accommodative policy that may lead to increased wealth inequality in the aftermath of the pandemic, and if it is within their abilities, to address such concerns.
Conclusion
The depth of the shock COVID has imparted on the U.S. economy suggests there could be a long- lasting downshift in potential output. An output gap has already started to form with the level of GDP much lower than what would have been possible in the absence of the pandemic. We will monitor potential output in the aftermath of the pandemic and expect policy to remain accommodative for longer in the post-COVID period. A byproduct of accommodative policy may cause further widening in wealth inequality in the United States.
1 Congressional Budget Office. “An Update to the Economic Outlook: 2020 to 2030.” July 2020.
2 Ball, Laurence. “Long-Term Damage from the Great Recession in OECD Countries,” (May 2014); Haltmaier, Jane. “Do Recessions Affect Potential Output?” (December 2012).
3 “Estimating the Cost of a Recession: Temporary or Long Lasting?” (February 06, 2017).
4 Potential level data from the Congressional Budget Office was used for the nine variables.
5 The average annual reduction in the level of real disposable personal income was 10.7%, 20.1% in business fixed investment, 7.8% in employment, 6.9% in total factor productivity, 2.2% in the labor force, 7.9% in labor productivity and a 6.4% reduction in capital services.
6 Powell, Jerome H. “Monetary Policy in a Changing Economy.” August 23, 2018.
Read the full report in pdf
Wells Fargo Securities Economics Group publications are produced by Wells Fargo Securities, LLC, a U.S. broker-dealer registered with the U.S. Securities and Exchange Commission, the Financial Industry Regulatory Authority, and the Securities Investor Protection Corp. Wells Fargo Securities, LLC, distributes these publications directly and through subsidiaries including, but not limited to, Wells Fargo & Company, Wells Fargo Bank N.A., Wells Fargo Clearing Services, LLC, Wells Fargo Securities International Limited, Wells Fargo Securities Canada, Ltd., Wells Fargo Securities Asia Limited and Wells Fargo Securities (Japan) Co. Limited. Wells Fargo Securities, LLC. is registered with the Commodities Futures Trading Commission as a futures commission merchant and is a member in good standing of the National Futures Association. Wells Fargo Bank, N.A. is registered with the Commodities Futures Trading Commission as a swap dealer and is a member in good standing of the National Futures Association. Wells Fargo Securities, LLC. and Wells Fargo Bank, N.A. are generally engaged in the trading of futures and derivative products, any of which may be discussed within this publication. Wells Fargo Securities, LLC does not compensate its research analysts based on specific investment banking transactions. Wells Fargo Securities, LLC’s research analysts receive compensation that is based upon and impacted by the overall profitability and revenue of the firm which includes, but is not limited to investment banking revenue. The information and opinions herein are for general information use only. Wells Fargo Securities, LLC does not guarantee their accuracy or completeness, nor does Wells Fargo Securities, LLC assume any liability for any loss that may result from the reliance by any person upon any such information or opinions. Such information and opinions are subject to change without notice, are for general information only and are not intended as an offer or solicitation with respect to the purchase or sales of any security or as personalized investment advice. Wells Fargo Securities, LLC is a separate legal entity and distinct from affiliated banks and is a wholly owned subsidiary of Wells Fargo & Company © 2020 Wells Fargo Securities, LLC.
Important Information for Non-U.S. Recipients
For recipients in the EEA, this report is distributed by Wells Fargo Securities International Limited ("WFSIL"). WFSIL is a U.K. incorporated investment firm authorized and regulated by the Financial Conduct Authority. For the purposes of Section 21 of the UK Financial Services and Markets Act 2000 (“the Act”), the content of this report has been approved by WFSIL, an authorized person under the Act. WFSIL does not deal with retail clients as defined in the Directive 2014/65/EU (“MiFID2”). The FCA rules made under the Financial Services and Markets Act 2000 for the protection of retail clients will therefore not apply, nor will the Financial Services Compensation Scheme be available. This report is not intended for, and should not be relied upon by, retail clients.