Summary
The outlook for inflation in the United States is currently receiving more attention than it has for quite some time. Market-based inflation expectations have shot up to a six-year high and point to inflation finally breaking out of the past decade's rut. The U.S. economy has experienced three episodes over the past six decades in which consumer prices meaningfully accelerated. In this report, we examine those periods to see if the past can tell us anythingabout the possibility of inflation breaking significantly higher over the next couple of years.
In the second half of the 1960s, consumer price inflation rose to 6% from less than 2%, largely on the back of a surge in government spending. The two oil price shocks of the 1970s caused CPI inflation to skyrocket to nearly 15% in early 1980. Finally, in the mid-to-late 1980s, easing monetary policy in combination with expansionary fiscal policy helped push consumer price inflation back up to 5%. In today's environment of rising commodity prices, an unprecedented amount of fiscal transfers to households and central bankers more worried about employment than inflation, could we be in for a repeat?
While there are notable similarities between today and the “Great Inflation,” there are also important differences. First, when government spending ramped up in the late 1960s, the labor market was already close to full employment—something we are far from today. Second, the oil price spikes of the 1970s were particularly damaging because about half of consumer spending was on goods at the time, and petroleum was a primary source of energy. Today, goods account for only about one-third of consumer spending and the U.S. economy uses a more diverse mix of energy sources. At the same time, wage indexing was more common in the 1970s, leading to an automatic source of cost acceleration.
We expect that the rate of CPI inflation will rise to 2.7% this year from 1.2% in 2020 before edging down to 2.4% in 2022. While the combination of trillions of dollars in direct support to households and a Federal Reserve that would rather err on the side of staying too easy for too long opens up a real possibility for inflation to shoot significantly higher, we suspect the rise in consumers prices will not be as sharp as it was in the three episodes we highlight in this report. In our view, the combination of slower growth in many of America's major trading partners, remaining slack in the labor market and contained expectations of future inflation—helped by the Fed's previous efforts to break a coercive inflationary spiral—should prevent inflation from becoming unbridled over the next few years. That said, we will be watching developments closely to ascertain whether adjustments to our forecasts are warranted.
Is Higher Inflation on the Way?
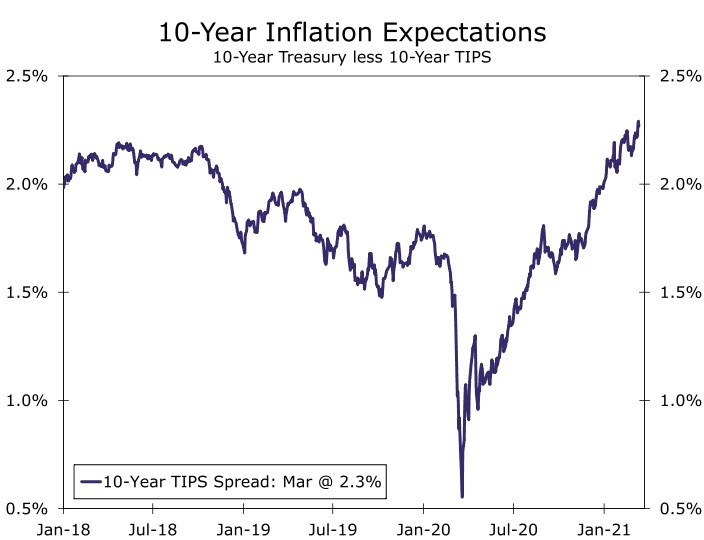
The outlook for inflation in the United States is currently receiving more attention than it has for quite some time. The yield on the 10-year Treasury security has risen about 70 bps since the beginning of the year due to, at least in part, expectations for higher inflation. In that regard, the yield spread between this 10-year government note and the 10-year inflation-protected security (TIPS), which is often used as a market-based measure of inflation expectations over the next ten years, recently rose to its highest level since 2014 (Figure 1). Survey-based measures of inflation expectations have also trended up since last spring.
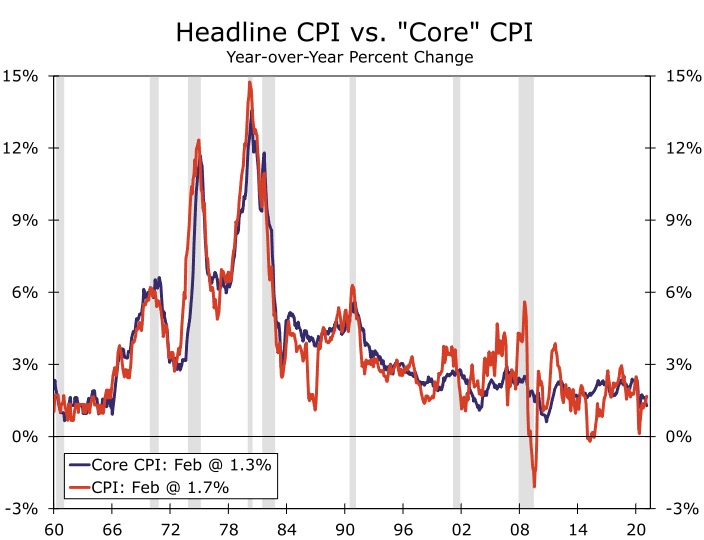
The recent increase in Treasury yields and the associated rise in inflation expectations reflect an improved outlook for the U.S. economy. In December, the median forecast among the Blue Chip panel of forecasters looked for U.S. real GDP growth of 3.9% in 2021. By early March, the median forecast had strengthened to 5.8%. (We are currently above consensus with a 6.4% forecast for 2021). We expect that the combination of low-base effects from last year and strong demand this year will lift overall CPI inflation from the year-over-year rate of 1.7% that it posted in February to more than 3% by summer. But as we also explained in a recent report, inflation is a process. A one-off increase in prices does not necessarily mean that the Consumer Price Index will continue to accelerate on an ongoing basis.
Figure 1
Source: Bloomberg LP and Wells Fargo Securities
Figure 2
Source: U.S. Department of Labor and Wells Fargo Securities
Using History to Shed Light on the Present
Over the past 60 years, the U.S. economy has experienced three episodes in which rates of consumer price inflation have moved meaningfully higher over the course of a few years. As shown in Figure 2, the overall rate of CPI inflation rose to more than 6% by late-1969 from less than 2% in late-1965. The second episode, which was associated with the oil price shocks of the 1970s, saw CPI inflation shoot up in two waves from roughly 3% in 1972 to nearly 15% in early-1980. The last major episode occurred in the late 1980s, when CPI inflation trended up to more than 6% in late 1990 from less than 2% at the beginning of 1987. Subsequently, the year-over-year rate of CPI inflation, which has not exceeded 6% since 1990, has been more or less benign. An entire generation of Americans has grown up not experiencing relatively high rates of inflation.
In the remainder of this report, we look at each episode in more detail to ascertain what caused inflation to move meaningfully higher. We undertake this historical tour with a view to determine if the current environment is conducive to a period of considerably higher inflation in the next few years.
The Late 1960s: Guns and Butter
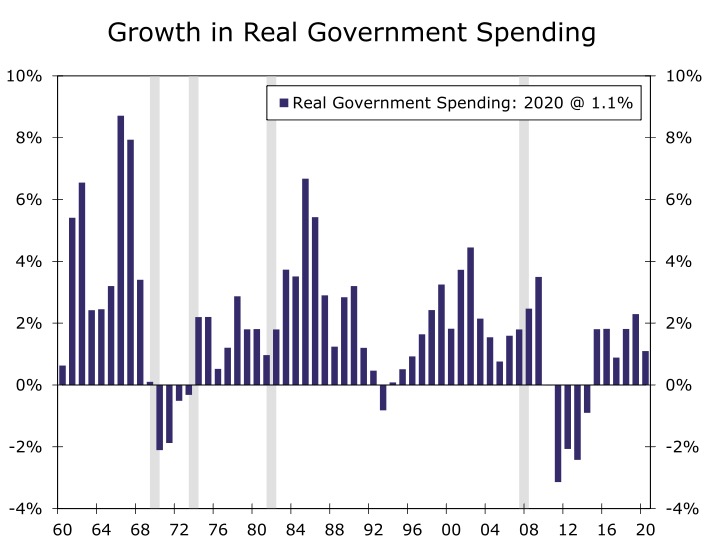
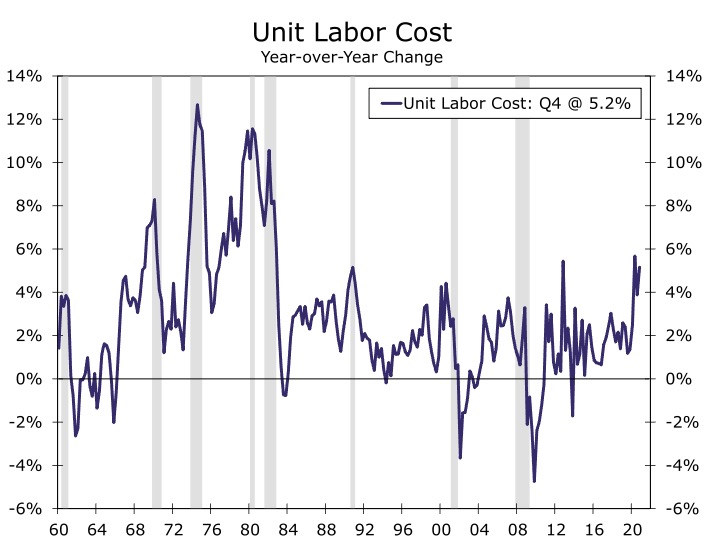
The acceleration in consumer prices that began in 1966 coincided with a significant increase in spending by the federal government. Not only was President Lyndon Johnson fighting a war on poverty through the so-called Great Society programs, but military spending was rising rapidly because of the escalating conflict in Vietnam. As shown in Figure 3, annual growth in real government spending jumped from 3.2% in 1965 to 8.7% in 1966 and 7.9% in 1967. Real GDP growth averaged 4.3% per annum between 1966 and 1969, and these strong growth rates drove the unemployment rate, which stood at 5.0% at the beginning of 1965, to a 15-year low of only 3.4% by late 1968. The drop in the unemployment rate was associated with a marked acceleration in unit labor costs (Figure 4), which coincided with the rise in CPI inflation. In short, significant fiscal stimulus in an economy that was already reasonably close to full employment appears to be a contributing factor, if not a primary cause, of the inflation run-up that occurred in the late 1960s.
Figure 3
Source: U.S. Department of Commerce and Wells Fargo Securities
Figure 4
Source: U.S. Department of Labor and Wells Fargo Securities
The Oil Price Shocks of the 1970s
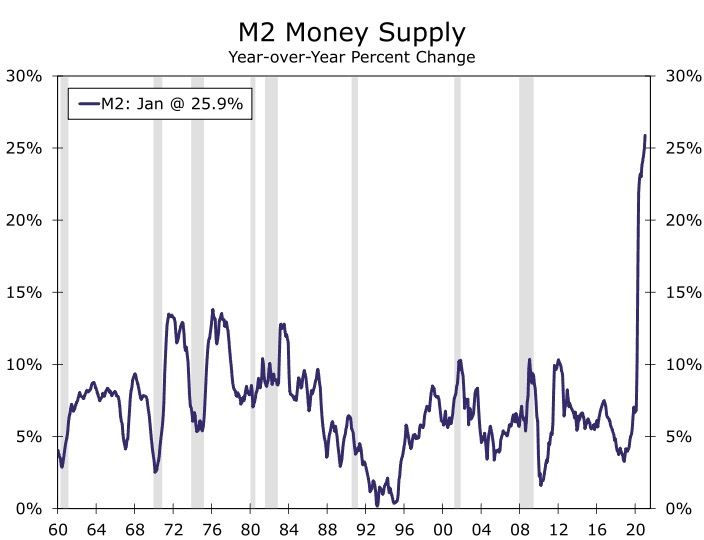
Inflation was already starting to head higher as the economy picked up steam from the rather brief and shallow recession that spanned Q4-1969 to Q4-1970. This rise in the inflation rate coincided with a marked acceleration in the money supply starting in 1971 (Figure 5). The rate of CPI inflation then spiked higher in the aftermath of the OPEC oil embargo that caused the price of crude oil to shoot up to more than $10/barrel in January 1974 from about $4/barrel in October 1973. Inflation subsided somewhat in the aftermath of the Q4-1973 to Q1-1975 recession, but it surged higher again when oil shortages in the wake of the Iranian revolution caused the price of crude to skyrocket from about $16/barrel in March 1979 to $40/barrel a year later.
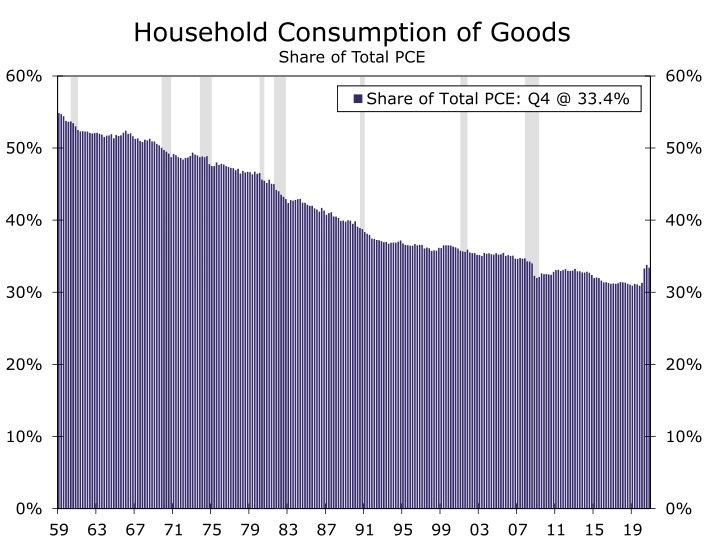
Although energy goods and services accounted for only 6% of overall consumer expenditures at the beginning of 1973—the share is less than 4% today—the oil price hikes that occurred during that decade reverberated throughout the economy. As shown in Figure 6, spending on goods represented about one-half of overall personal consumption expenditures in the early 1970s. Since many American factories at the time used petroleum as a primary source of energy, the sharp rise in oil prices pushed up the cost of production of most goods, which were then passed on to consumers via higher prices.
Furthermore, a growing share of American workers had price indexation clauses in their wage contracts. In 1966, 22% of workers under collective bargaining agreements had cost of living clauses in their contract, but the share grew to around 60% in the mid-to-late 1970s1. The increase in the price level that was set in motion by the oil price hikes led to automatic acceleration in wages, which pushed up costs further. Unit labor costs rose at double-digit rates following the first oil price shock in 1973 and again following the second shock in 1979 (Figure 4). The inflation of the 1960s was very much of the demand-pull variety, whereas the high rates of inflation that occurred a decade later were more of the cost-push variety.
Figure 5
Source: Federal Reserve System and Wells Fargo Securities
Figure 6
Source: U.S. Department of Commerce and Wells Fargo Securities
The Late 1980s: Expansionary Macroeconomic Policies Redux
In an effort to wring high rates of inflation out of the economy, the Federal Reserve tightened monetary policy significantly, which caused interest rates to skyrocket. The fed funds rate shot up to more than 20% in 1981, which sent the economy tumbling into a deep recession in 1981-82. But the marked tightening of monetary policy succeeded in bringing down rates of consumer price inflation (Figure 2). By the end of 1986, the rate of CPI inflation had receded to only 1% (helped in part by an OPEC price war that caused oil prices to tumble to $10/barrel in early 1986). As inflation fell, interest rates came tumbling back down.
The combination of monetary easing and expansionary fiscal policy—the United States cut taxes and began a defense build-up in the early years of the Reagan administration (Figure 3)—led to an economic boom starting in 1983. Real GDP growth averaged 4.4% per annum between 1983 and 1989. The unemployment rate, which had approached 11% in late 1982, began to trend lower. By mid-1987 it had receded to 6%. The combination of strong economic growth and rising oil prices (from their price war-induced lows in 1986) caused the overall CPI inflation rate to trend up from about 1% in late 1986 to nearly 5% by the end of the decade.
The Current Conjuncture: Back to the Future?
This brings us to the present, in which some similarities with the past three higher inflation episodes are eerily present. As noted earlier, expansionary economic policies contributed to price accelerations in the late 1960s and again in the 1980s. Fast-forward to today. The Federal Open Market Committee (FOMC) slashed its target range for the federal funds rate to 0.00%-0.25% in March 2020, where it currently remains. The yield on the 10-year Treasury security fell to only 0.50% last August, which pulled most long-term borrowing rates for households and businesses lower. Although yields on U.S. Treasury securities have risen recently, they remain extraordinarily low in a historical context.
Fiscal policy has also been very expansionary since the pandemic started. Enacted fiscal relief packages have pumped trillions of dollars of disposable income into the economy, with more arriving shortly (Figure 7). Much of this potential spending power is currently sitting in bank deposits, which has caused money supply growth to spike (Figure 5). But this excess savings, which is more or less lying dormant today, could finance robust consumer spending growth once the economy fully re-opens.
The jump in costs in the 1970s pushed up the inflation rate during that decade, and there are signs of supply constraints and higher costs today. The social distancing protocols that the pandemic has necessitated has weighed on supply capacity in some industries. The need to care for homebound children and older adults has contributed to the 2.6% contraction in the labor force since the pandemic began. Total compensation costs in the private sector rose at an annualized rate of 3.5% in Q4-2020, the largest sequential rate of increase in nearly three years.
Figure 7

Source: U.S. Department of Commerce and Wells Fargo Securities
Figure 8
Source: U.S. Department of Labor and Wells Fargo Securities
Return to Double-digit Inflation? Not so Fast
Does this mean that a burst of sharply higher inflation is right around the corner? Not necessarily. For one, the jump in the money supply has been driven by the recent fiscal relief packages passed by Congress (Figure 5). The aid reflects one-time payments in the form of household checks, or short-term programs like enhanced unemployment insurance. In other words, the one-off nature of the fiscal relief leaves the money supply hard-pressed to grow at such a lofty pace later this year.
In addition, just because households have racked up such ample savings, does not imply that they will necessarily spend all of it as soon as the economy re-opens. Households could very well keep some of the accumulated savings for a rainy day after two “once in a lifetime” shocks in the span of a dozen years. Other channels for “excess savings” include paying down debt or purchasing assets. And while the stock market has more than recovered and home prices are up 10% over the past year, asset inflation is not the same as consumer price inflation.
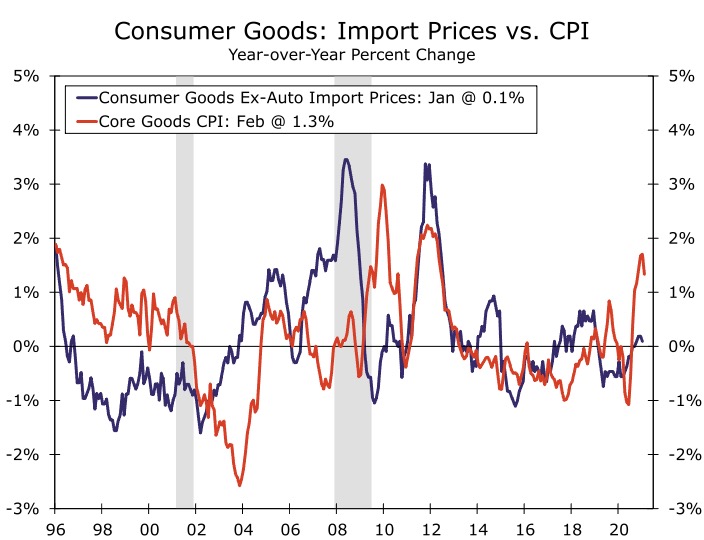
The United States should be toward the front of the pack in terms of global growth this year following such substantial policy support, but growth among other advanced economies is likely to be less impressive. The combination of slower growth in many major trading partners and only a modest amount of dollar depreciation, which we forecast, should keep import prices of consumer goods from ratcheting significantly higher. Indeed, prices of imported consumer goods are essentially flat at present on a year-ago basis (Figure 8).
As noted previously, services have grown to account for roughly two-thirds of households spending (Figure 6). With labor representing the largest cost for most service providers, rising wage costs would put upward pressure on the prices of many services. However, a sharp upward spiral in wages such as occurred in the 1970s and 1980s looks less likely today. Unionized workers, who are more likely to have cost of living adjustment (COLA) clauses in their contracts, have fallen from 17% of private sector workers in 1983 to 6% today. What's more, the use of COLA clauses in collective bargaining contracts declined as inflation quieted down, dropping to 22% by 1995.
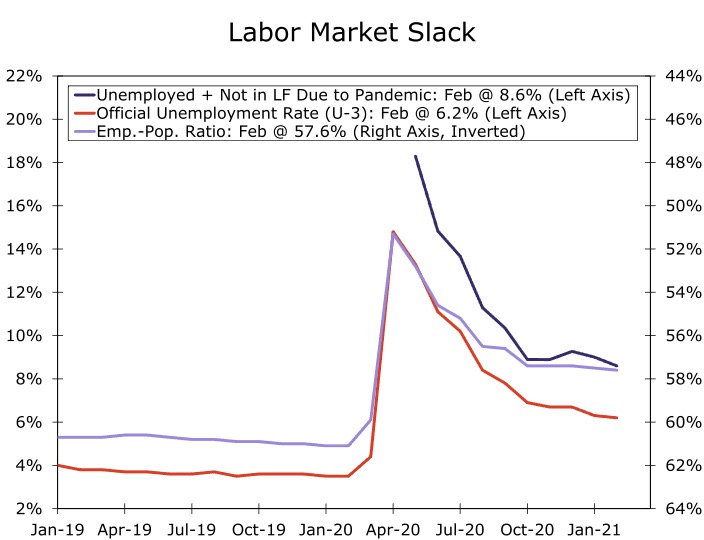
Not only do a smaller share of workers today appear to be automatically covered by cost-of-living increases, but there remains more slack in the labor market than implied by the 6.2% unemployment rate after more than four million individuals have left the labor force since COVID (Figure 9). We expect that many individuals who exited the labor force will make their way back when health concerns abate and schools fully return to in-person learning. As we wrote in a recent report, we look for the labor force participation rate, which currently stands at only 61.4%, to begin to trend back toward its pre-pandemic level of 63.4% as the economy re-opens in coming months. The return of millions of individuals to the labor market should provide a relief valve for wage pressures.
Figure 9
Source: U.S. Department of Labor and Wells Fargo Securities
Figure 10
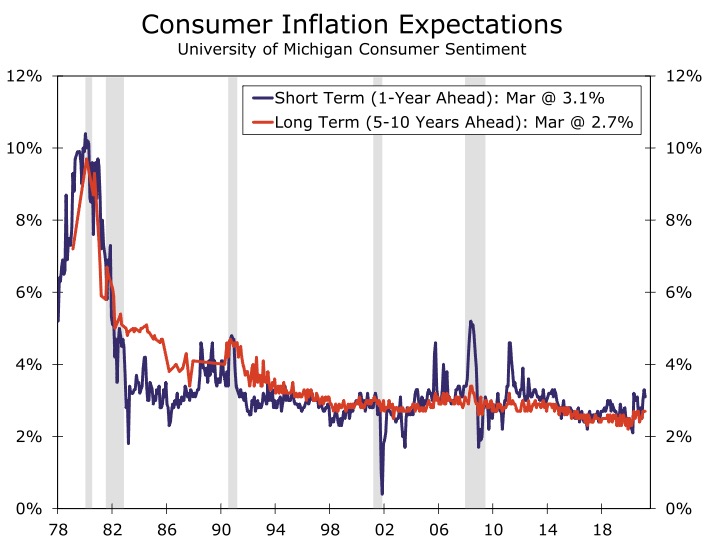
Source: University of Michigan and Wells Fargo Securities
Another important distinction of today's environment is that the Federal Reserve has a track record for fighting unbridled inflation. Under Fed Chair Paul Volcker in the early 1980s, the central bank illustrated that it was willing to temporarily forgo economic growth and even spark a recession if it meant breaking a corrosive inflationary spiral. If inflation or inflation expectations were appearing to run away, the Fed has unlimited room to raise rates, even if the short-term consequences would be far from pleasant. Merely having the option to take a page out of Volcker's playbook should help limit the rise in inflation expectations and reduce the chance of the current FOMC needing to exercise that option. Although longer-term inflation expectations have ticked up in recent months, they remain well below the levels of the 1980s and 1990s. Specifically, the University of Michigan's survey of consumer sentiment shows that the median estimate of inflation over the next 5-to-10 years is 2.7% (Figure 10). This estimate was near 5% in the early 1990s and close to 10% a decade earlier.
Conclusion
Over the past six decades, the American economy has endured three episodes of meaningful acceleration in consumer prices. The most significant rise in inflation occurred in the 1970s and early 1980s following the OPEC oil price shocks. Although supply constraints have pushed up the prices of some goods recently, the high inflation of the 1970s probably has less relevance for today's environment than the episodes that occurred in the late 1960s and again two decades later. Those two episodes of price acceleration were associated with periods of significant fiscal stimulus in an economy that was closing in on full employment. The rise in unit labor costs were then passed on to consumers, at least in part, via higher prices.
As we outline in our most recent U.S. Economic Outlook, we expect that the year-over-year rate of CPI inflation, which dipped as low as 0.1% in May 2020, will be closing in on 3.5% in the next few months. But we look for it to fall back to 2.5% or so in 2022. In our view, the combination of slower growth in many of America's major trading partners, a rebound in the labor force participation rate, which should keep wage inflation in check, and contained expectations of future inflation should prevent inflation from rising further in coming years.
That said, we acknowledge the risk that inflation could turn out to be higher than we currently expect. We will be keeping our eyes on the prices of important commodities, indices of inflation expectations and measures of labor market slack to determine whether we need to make revisions to our forecasts of consumer price inflation.
Endnotes
1Devine, J. “Cost-of-living Clauses: Trends and Current Characteristics” Bureau of Labor Statistics. December 1996. (Return to Section)
Required Disclosures
This report is produced by the Economics Group of Wells Fargo Securities, LLC, a U.S. broker-dealer registered with the U.S. Securities and Exchange Commission, the Financial Industry Regulatory Authority, and the Securities Investor Protection Corp. Wells Fargo Securities, LLC, distributes this report directly and through affiliates including, but not limited to, Wells Fargo & Company, Wells Fargo Bank N.A., Wells Fargo Clearing Services, LLC, Wells Fargo Securities International Limited, Wells Fargo Securities Europe S.A., Wells Fargo Securities Canada, Ltd., Wells Fargo Securities Asia Limited and Wells Fargo Securities (Japan) Co. Limited. Wells Fargo Securities, LLC is registered with the Commodity Futures Trading Commission as a futures commission merchant and is a member in good standing of the National Futures Association. Wells Fargo Bank, N.A. is registered with the Commodity Futures Trading Commission as a swap dealer and is a member in good standing of the National Futures Association. Wells Fargo Securities, LLC and Wells Fargo Bank, N.A. are generally engaged in the trading of futures and derivative products, any of which may be discussed within this report.
The information in this report has been obtained or derived from sources believed by Wells Fargo Securities, LLC to be reliable, but Wells Fargo Securities, LLC does not guarantee its accuracy or completeness, nor does Wells Fargo Securities, LLC assume any liability for any loss that may result from the reliance by any person upon any such information or upon any opinions set forth herein. Such information and opinions are subject to change without notice, are for general information only and are not intended as an offer or solicitation with respect to the purchase or sale of any security or other financial product or as personalized investment advice. Wells Fargo Securities, LLC is a separate legal entity and distinct from affiliated banks and is a wholly owned subsidiary of Wells Fargo & Company. © 2021 Wells Fargo Securities, LLC
Important Information for Non-U.S. Recipients
For recipients in the United Kingdom, this report is distributed by Wells Fargo Securities International Limited ("WFSIL"). WFSIL is a U.K. incorporated investment firm authorized and regulated by the Financial Conduct Authority. For the purposes of Section 21 of the UK Financial Services and Markets Act 2000 (“the Act”), the content of this report has been approved by WFSIL, an authorized person under the Act. WFSIL does not deal with retail clients as defined in the Directive 2014/65/EU (“MiFID2”). The FCA rules made under the Financial Services and Markets Act 2000 for the protection of retail clients will therefore not apply, nor will the Financial Services Compensation Scheme be available. For recipients in the EEA, this report is distributed by WFSIL or Wells Fargo Securities Europe S.A. (“WFSE”). WFSE is a French incorporated investment firm authorized and regulated by the Autorité de contrôle prudentiel et de résolution and the Autorité des marchés financiers. WFSE does not deal with retail clients as defined in the Directive 2014/65/EU (“MiFID2”). This report is not intended for, and should not be relied upon by, retail clients.
SECURITIES: NOT FDIC-INSURED - MAY LOSE VALUE - NO BANK GUARANTEE