Executive Summary
The long, long bull market since 2009 has finally matured into a fully-fledged epic bubble. Featuring extreme overvaluation, explosive price increases, frenzied issuance, and hysterically speculative investor behavior, I believe this event will be recorded as one of the great bubbles of financial history, right along with the South Sea bubble, 1929, and 2000.
These great bubbles are where fortunes are made and lost – and where investors truly prove their mettle. For positioning a portfolio to avoid the worst pain of a major bubble breaking is likely the most difficult part. Every career incentive in the industry and every fault of individual human psychology will work toward sucking investors in.
But this bubble will burst in due time, no matter how hard the Fed tries to support it, with consequent damaging effects on the economy and on portfolios. Make no mistake – for the majority of investors today, this could very well be the most important event of your investing lives. Speaking as an old student and historian of markets, it is intellectually exciting and terrifying at the same time. It is a privilege to ride through a market like this one more time.
“The one reality that you can never change is that a higher-priced asset will produce a lower return than a lower-priced asset. You can’t have your cake and eat it. You can enjoy it now, or you can enjoy it steadily in the distant future, but not both – and the price we pay for having this market go higher and higher is a lower 10-year return from the peak.”1
Most of the time, perhaps three-quarters of the time, major asset classes are reasonably priced relative to one another. The correct response is to make modest bets on those assets that measure as being cheaper and hope that the measurements are correct. With reasonable skill at evaluating assets the valuation-based allocator can expect to survive these phases intact with some small outperformance. “Small” because the opportunities themselves are small. If you wanted to be unfriendly you could say that asset allocation in this phase is unlikely to be very important. It would certainly help in these periods if the manager could also add value in the implementation, from the effective selection of countries, sectors, industries, and individual securities as well as major asset classes.
The real trouble with asset allocation, though, is in the remaining times when asset prices move far away from fair value. This is not so bad in bear markets because important bear markets tend to be short and brutal. The initial response of clients is usually to be shocked into inaction during which phase the manager has time to reposition both portfolio and arguments to retain the business. The real problem is in major bull markets that last for years. Long, slow-burning bull markets can spend many years above fair value and even two, three, or four years far above. These events can easily outlast the patience of most clients. And when price rises are very rapid, typically toward the end of a bull market, impatience is followed by anxiety and envy. As I like to say, there is nothing more supremely irritating than watching your neighbors get rich.
How are clients to tell the difference between extreme market behavior and a manager who has lost his way? The usual evidence of talent is past success, but the long cycles of the market are few and far between. Winning two out of two events or three out of three is not as convincing as a larger sample size would be. Even worse the earlier major market breaks are already long gone: 2008, 2000, or 1989 in Japan are practically in the history books. Most of the players will have changed. Certainly, the satisfaction felt by others who eventually won long ago is no solace for current pain experienced by you personally. A simpler way of saying this may be that if Keynes really had said, “The market can stay irrational longer than the investor can stay solvent,” he would have been right.
I am long retired from the job of portfolio management but I am happy to give my opinion here: it is highly probable that we are in a major bubble event in the U.S. market, of the type we typically have every several decades and last had in the late 1990s. It will very probably end badly, although nothing is certain. I will also tell you my definition of success for a bear market call. It is simply that sooner or later there will come a time when an investor is pleased to have been out of the market. That is to say, he will have saved money by being out, and also have reduced risk or volatility on the round trip. This definition of success absolutely does not include precise timing. (Predicting when a bubble breaks is not about valuation. All prior bubble markets have been extremely overvalued, as is this one. Overvaluation is a necessary but not sufficient condition for their bursting.) Calling the week, month, or quarter of the top is all but impossible.
I came fairly close to calling one bull market peak in 2008 and nailed a bear market low in early 2009 when I wrote “Reinvesting When Terrified.” That’s far more luck than I could hope for even over a 50-year career. Far more typically, I was three years too early in the Japan bubble. We at GMO got entirely out of Japan in 1987, when it was over 40% of the EAFE benchmark and selling at over 40x earnings, against a previous all-time high of 25x. It seemed prudent to exit at the time, but for three years we underperformed painfully as the Japanese market went to 65x earnings on its way to becoming over 60% of the benchmark! But we also stayed completely out for three years after the top and ultimately made good money on the round trip.
Similarly, in late 1997, as the S&P 500 passed its previous 1929 peak of 21x earnings, we rapidly sold down our discretionary U.S. equity positions then watched in horror as the market went to 35x on rising earnings. We lost half our Asset Allocation book of business but in the ensuing decline we much more than made up our losses.
Believe me, I know these are old stories. But they are directly relevant. For this current market event is indeed the same old story. This summer, I said it was likely that we were in the later stages of a bubble, with some doubt created by the unique features of the COVID crash. The single most dependable feature of the late stages of the great bubbles of history has been really crazy investor behavior, especially on the part of individuals. For the first 10 years of this bull market, which is the longest in history, we lacked such wild speculation. But now we have it. In record amounts. My colleagues Ben Inker and John Pease have written about some of these examples of mania in the most recent GMO Quarterly Letter, including Hertz, Kodak, Nikola, and, especially, Tesla. As a Model 3 owner, my personal favorite Tesla tidbit is that its market cap, now over $600 billion, amounts to over $1.25 million per car sold each year versus $9,000 per car for GM. What has 1929 got to equal that? Any of these tidbits could perhaps be dismissed as isolated cases (trust me: they are not), but big-picture metrics look even worse.
The "Buffett indicator," total stock market capitalization to GDP, broke through its all-time-high 2000 record. In 2020, there were 480 IPOs (including an incredible 248 SPACs2) – more new listings than the 406 IPOs in 2000. There are 150 non-micro-cap companies (that is, with market capitalization of over $250 million) that have more than tripled in the year, which is over 3 times as many as any year in the previous decade. The volume of small retail purchases, of less than 10 contracts, of call options on U.S. equities has increased 8-fold compared to 2019, and 2019 was already well above long-run average. Perhaps most troubling of all: Nobel laureate and long-time bear Robert Shiller – who correctly and bravely called the 2000 and 2007 bubbles and who is one of the very few economists I respect – is hedging his bets this time, recently making the point that his legendary CAPE asset-pricing indicator (which suggests stocks are nearly as overpriced as at the 2000 bubble peak) shows less impressive overvaluation when compared to bonds. Bonds, however, are even more spectacularly expensive by historical comparison than stocks. Oh my!
So, I am not at all surprised that since the summer the market has advanced at an accelerating rate and with increasing speculative excesses. It is precisely what you should expect from a late-stage bubble: an accelerating, nearly vertical stage of unknowable length – but typically short. Even if it is short, this stage at the end of a bubble is shockingly painful and full of career risk for bears.
I am doubling down, because as prices move further away from trend, at accelerating speed and with growing speculative fervor, of course my confidence as a market historian increases that this is indeed the late stage of a bubble. A bubble that is beginning to look like a real humdinger.
The strangest feature of this bull market is how unlike every previous great bubble it is in one respect. Previous bubbles have combined accommodative monetary conditions with economic conditions that are perceived at the time, rightly or wrongly, as near perfect, which perfection is extrapolated into the indefinite future. The state of economic excellence of any previous bubble of course did not last long, but if it could have lasted, then the market would justifiably have sold at a huge multiple of book. But today’s wounded economy is totally different: only partly recovered, possibly facing a double-dip, probably facing a slowdown, and certainly facing a very high degree of uncertainty. Yet the market is much higher today than it was last fall when the economy looked fine and unemployment was at a historic low. Today the P/E ratio of the market is in the top few percent of the historical range and the economy is in the worst few percent. This is completely without precedent and may even be a better measure of speculative intensity than any SPAC.
This time, more than in any previous bubble, investors are relying on accommodative monetary conditions and zero real rates extrapolated indefinitely. This has in theory a similar effect to assuming peak economic performance forever: it can be used to justify much lower yields on all assets and therefore correspondingly higher asset prices. But neither perfect economic conditions nor perfect financial conditions can last forever, and there’s the rub.
All bubbles end with near universal acceptance that the current one will not end yet…because. Because in 1929 the economy had clicked into “a permanently high plateau”; because Greenspan’s Fed in 2000 was predicting an enduring improvement in productivity and was pledging its loyalty (or moral hazard) to the stock market; because Bernanke believed in 2006 that “U.S. house prices merely reflect a strong U.S. economy” as he perpetuated the moral hazard: if you win you’re on your own, but if you lose you can count on our support. Yellen, and now Powell, maintained this approach. All three of Powell’s predecessors claimed that the asset prices they helped inflate in turn aided the economy through the wealth effect. Which effect we all admit is real. But all three avoided claiming credit for the ensuing market breaks that inevitably followed: the equity bust of 2000 and the housing bust of 2008, each replete with the accompanying anti-wealth effect that came when we least needed it, exaggerating the already guaranteed weakness in the economy. This game surely is the ultimate deal with the devil.
Now once again the high prices this time will hold because…interest rates will be kept around nil forever, in the ultimate statement of moral hazard – the asymmetrical market risk we have come to know and depend on. The mantra of late 2020 was that engineered low rates can prevent a decline in asset prices. Forever! But of course, it was a fallacy in 2000 and it is a fallacy now. In the end, moral hazard did not stop the Tech bubble decline, with the NASDAQ falling 82%. Yes, 82%! Nor, in 2008, did it stop U.S. housing prices declining all the way back to trend and below – which in turn guaranteed first, a shocking loss of over eight trillion dollars of perceived value in housing; second, an ensuing weakness in the economy; and third, a broad rise in risk premia and a broad decline in global asset prices (see Exhibit 1). All the promises were in the end worth nothing, except for one; the Fed did what it could to pick up the pieces and help the markets get into stride for the next round of enhanced prices and ensuing decline. And here we are again, waiting for the last dance and, eventually, for the music to stop.
EXHIBIT 1: BUBBLES – GREAT WHILE THEY LAST
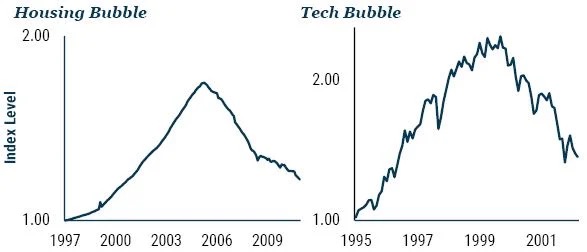
Housing bubble as of 11/30/2011, Tech bubble as of 2/28/2003
Source: S&P 500 (Tech bubble); National Association of Realtors, U.S. Census Bureau (Housing bubble)
Nothing in investing perfectly repeats. Certainly not investment bubbles. Each form of irrational exuberance is different; we are just looking for what you might call spiritual similarities. Even now, I know that this market can soar upwards for a few more weeks or even months – it feels like we could be anywhere between July 1999 and February 2000. Which is to say it is entitled to break any day, having checked all the boxes, but could keep roaring upwards for a few months longer. My best guess as to the longest this bubble might survive is the late spring or early summer, coinciding with the broad rollout of the COVID vaccine. At that moment, the most pressing issue facing the world economy will have been solved. Market participants will breathe a sigh of relief, look around, and immediately realize that the economy is still in poor shape, stimulus will shortly be cut back with the end of the COVID crisis, and valuations are absurd. “Buy the rumor, sell the news.” But remember that timing the bursting of bubbles has a long history of disappointment.
Even with hindsight, it is seldom easy to point to the pin that burst the bubble. The main reason for this lack of clarity is that the great bull markets did not break when they were presented with a major unexpected negative. Those events, like the portfolio insurance fiasco of 1987, tend to give sharp down legs and quick recoveries. They are in the larger scheme of things unique and technical and are not part of the ebb and flow of the great bubbles. The great bull markets typically turn down when the market conditions are very favorable, just subtly less favorable than they were yesterday. And that is why they are always missed.
Either way, the market is now checking off all the touchy-feely characteristics of a major bubble. The most impressive features are the intensity and enthusiasm of bulls, the breadth of coverage of stocks and the market, and, above all, the rising hostility toward bears. In 1929, to be a bear was to risk physical attack and guarantee character assassination. For us, 1999 was the only experience we have had of clients reacting as if we were deliberately and maliciously depriving them of gains. In comparison, 2008 was nothing. But in the last few months the hostile tone has been rapidly ratcheting up. The irony for bears though is that it’s exactly what we want to hear. It’s a classic precursor of the ultimate break; together with stocks rising, not for their fundamentals, but simply because they are rising.
Another more measurable feature of a late-stage bull, from the South Sea bubble to the Tech bubble of 1999, has been an acceleration3 of the final leg, which in recent cases has been over 60% in the last 21 months to the peak, a rate well over twice the normal rate of bull market ascents. This time, the U.S. indices have advanced from +69% for the S&P 500 to +100% for the Russell 2000 in just 9 months. Not bad! And there may still be more climbing to come. But it has already met this necessary test of a late-stage bubble.
It is a privilege as a market historian to experience a major stock bubble once again. Japan in 1989, the 2000 Tech bubble, the 2008 housing and mortgage crisis, and now the current bubble – these are the four most significant and gripping investment events of my life. Most of the time in more normal markets you show up for work and do your job. Ho hum. And then, once in a long while, the market spirals away from fair value and reality. Fortunes are made and lost in a hurry and investment advisors have a rare chance to really justify their existence. But, as usual, there is no free lunch. These opportunities to be useful come loaded with career risk.
So, here we are again. I expect once again for my bubble call to meet my modest definition of success: at some future date, whenever that may be, it will have paid for you to have ducked from midsummer of 2020. But few professional or individual investors will have been able to have ducked. The combination of timing uncertainty and rapidly accelerating regret on the part of clients means that the career and business risk of fighting the bubble is too great for large commercial enterprises. They can never put their full weight behind bearish advice even if the P/E goes to 65x as it did in Japan. The nearest any of these giant institutions have ever come to offering fully bearish advice in a bubble was UBS in 1999, whose position was nearly identical to ours at GMO. That is to say, somewhere between brave and foolhardy. Luckily for us though, they changed their tack and converted to a fully invested growth stock recommendation at UBS Brinson and its subsidiary, Phillips & Drew, in February 2000, just before the market peak. This took out the 800-pound gorilla that would otherwise have taken most of the rewards for stubborn contrariness. So, don't wait for the Goldmans and Morgan Stanleys to become bearish: it can never happen. For them it is a horribly non-commercial bet. Perhaps it is for anyone. Profitable and risk-reducing for the clients, yes, but commercially impractical for advisors. Their best policy is clear and simple: always be extremely bullish. It is good for business and intellectually undemanding. It is appealing to most investors who much prefer optimism to realistic appraisal, as witnessed so vividly with COVID. And when it all ends, you will as a persistent bull have overwhelming company. This is why you have always had bullish advice in a bubble and always will.
However, for any manager willing to take on that career risk – or more likely for the individual investor – requiring that you get the timing right is overreach. If the hurdle for calling a bubble is set too high, so that you must call the top precisely, you will never try. And that condemns you to ride over the cliff every cycle, along with the great majority of investors and managers.
What to Do?
As often happens at bubbly peaks like 1929, 2000, and the Nifty Fifty of 1972 (a second-tier bubble in the company of champions), today’s market features extreme disparities in value by asset class, sector, and company. Those at the very cheap end include traditional value stocks all over the world, relative to growth stocks. Value stocks have had their worst-ever relative decade ending December 2019, followed by the worst-ever year in 2020, with spreads between Growth and Value performance averaging between 20 and 30 percentage points for the single year! Similarly, Emerging Market equities are at 1 of their 3, more or less co-equal, relative lows against the U.S. of the last 50 years. Not surprisingly, we believe it is in the overlap of these two ideas, Value and Emerging, that your relative bets should go, along with the greatest avoidance of U.S. Growth stocks that your career and business risk will allow. Good luck!
1 Jeremy Grantham, CNBC, November 12, 2020.
2 A SPAC is a Special Purpose Acquisition Company, a shell that is created for the specific purpose of merging with some private company to take that company public more quickly than could have been the case with a normal initial public offering (IPO) process.
Disclaimer: The views expressed are the views of Jeremy Grantham through the period ending January 5, 2021, and are subject to change at any time based on market and other conditions. This is not an offer or solicitation for the purchase or sale of any security and should not be construed as such. References to specific securities and issuers are for illustrative purposes only and are not intended to be, and should not be interpreted as, recommendations to purchase or sell such securities.
Copyright © 2021 by GMO LLC. All rights reserved.
Link to the original article