FRBSF Economic Letter

FRBSF Economic Letter
Figure 1
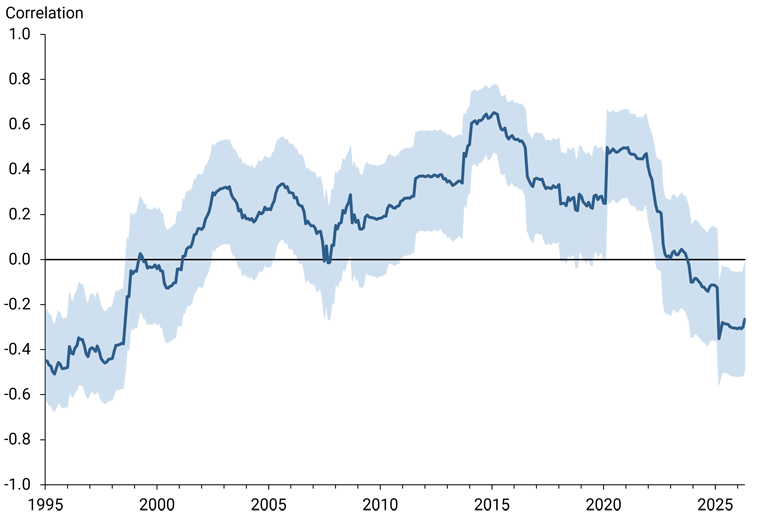
Source: Bloomberg and authors’ calculations. Shaded areas represent 95% confidence bands.
"Figure 1 shows the stock-bond correlation, computed from monthly Standard & Poor’s (S&P) 500 stock index prices and 10-year Treasury bond yields over a five-year trailing window, along with 95% confidence bands. The correlation displays considerable persistence, which suggests that it may reflect fundamental information about the economy rather than temporary fluctuations. The stock-bond correlation rose from a negative level of about –0.5 to close to zero before turning positive in the early 2000s. It stayed mostly positive until the early 2020s when it turned negative again (also see Duffee 2023)."
This chart and excerpt are sourced from the Economic Letter report, “Financial Markets, Oil Prices, and Supply-Side Risks“, by Thomas Mertens and Wesley Wasserburger; Federal Reserve Bank of San Francisco, August 10, 2026.
Opinions expressed in this FRBSF Economic Letter do not necessarily reflect the views of the management of the Federal Reserve Bank of San Francisco or the Board of Governors of the Federal Reserve System.