The rise of the penguin investor: Herding into momentum-like stocks has created a chill wind for value seekers.
Jonas Edholm, Portfolio Manager
Skagen Funds, 24 February 2020
How unpopular equities can rediscover their unconventional success.
Five major forces have driven the underperformance of traditional value equities over the last decade
How stocks are now polarized and the parallels with 50 years ago when sky-high valuations collapsed
The five emerging catalysts that could trigger a mid to long-term value recovery and secular rotation
Worldly wisdom teaches that it is better for reputation to fail conventionally than to succeed unconventionally.
― John Maynard Keynes, The General Theory of Employment, Interest, and Money
The Keynes quote above encapsulates today’s equity market environment. Contrarian value investing, defined in its original form as buying unpopular assets that are substantially undervalued relative to an estimate of fair value, is facing the threat of extinction. If you for are looking for a deeper global value equity fund with a contrarian investment style, you would probably have trouble finding one! The demise has occurred against a backdrop of unprecedented value underperformance, which has now lasted almost a decade. Last year was one of the most punishing; if you rank the relative monthly performance of value since 1995, three of the ten worst months were recorded in 2019.
We currently observe a valuation differential in global equity markets between cheap and expensive at record highs; a polarization price point which is reminiscent of the IT boom in 2000-2001. Importantly, this indicates a massive re-rating potential for traditional value assets compared to excessively priced “low volatility growth” stocks, with some at depressed valuations not seen since the aftermath of the financial crisis in 2008/2009.
We believe market efficiency has fallen substantially over the last few years with the massive 'anti-value' flows into passive instruments. In this paper, we seek to highlight the need for a more balanced investment approach as one that relies solely on "low volatility growth" stocks that have propelled global equity markets to new heights, could prove dangerous.
The Five Foes of Value
We believe five major forces have primarily driven the underperformance of traditional value equities over the last decade, which we highlight below:
1. Massive capital flows into passive investment vehicles where asset valuation is not considered in the investment decision. The underperformance of value over the last decade coincides with the USD 5 trillion rotation from active to passive management[1]. These flows simply direct capital into the biggest global companies, essentially following a momentum-type trading strategy that makes highly valued stocks even more expensive. They are highly anti-value in nature and have, at worst, removed the entire price discovery mechanism from global equity markets. We also fear that a passive approach often ignores the fiduciary investor responsibility, for example to engage with companies to improve governance and capital allocation. Ironically, we believe this shift has reduced market efficiency and created huge opportunities for longer-term focused active value investors.
2. The rise of “Super Big-Tech” companies has created long-term 'winners and losers' across global industries, with the victors completely destroying barriers to entry, which were previously viewed as insurmountable “moats”. The traditional retail and media sectors are good examples of industries where valuations have collapsed. As a result, they are now regarded by many investors as uninvestable. In today's black and white world, the market ignores shorter-term cash flows and relevant economic parameters such as pay-back periods and tangible assets like real estate embedded in non-core asset bases. These developments may also have mitigated the usual mean reversion of profit cycles. Indeed, fundamental value has been destroyed but we believe the market often fails to price stock specific opportunities accurately. Furthermore, valuations of the perceived “winner takes all” businesses remain extremely elevated and most are over-owned in our view. Many of these mega-cap companies are also burning cash while their valuations are often pricing in unrealistic monopolistic margins, despite the industries in which they operate being in their infancy.
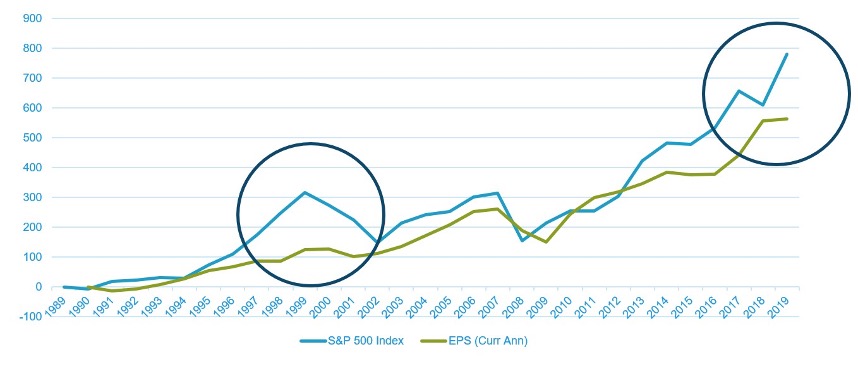
3. The ultra-low interest rates environment has fueled the attraction of companies with specific characteristics. The return required by investors to hold long duration assets has collapsed in line with the current interest rate environment. This also implies that shareholders believe these longer-term profits to be 'secure', which may be over-optimistic. Our view is that even a small uptick in interest rates would severely impede this group of assets as multiples would shrink. If this coincides with falling growth rates, we foresee a violent collapse in their valuations and a significant rotation into value assets. The vast part this group's strong equity performance has been driven by multiple expansion, as profit growth has been anemic but somehow accepted among investors.
Chart 1 – The disconnect: S&P 500 and earnings estimates for the current year
4. The domination of the penguin investor, fear of career risk and increasing focus on shorter-term investment horizons, in combination with a shrinking active value mandate pool, have impacted global equity markets. Herding among investors into momentum-like stocks with very little assessment of underlying asset prices is now the dominant approach of non-passive investors. This penguin-like behavior can also be observed among investment consultants and equity analysts.
5. Excessive focus on intangible asset values with less emphasis on tangible assets and short to mid-term cash flow generation over the last decade, and increasingly so since 2017. With intangible assets seen as the key drivers of company growth, traditional value metrics such as price/book and price/earnings have been viewed with increasing skepticism. While it is undisputable that intangible assets clearly have economic value for the likes of software companies or those selling branded consumer goods, we must question why the market today thinks these assets have suddenly become so much more valuable? Tangible balance sheet values are subsequently ignored in the current environment, evidenced, for example, by the substantial undervaluation of Japanese small and mid-caps. This discount is even more pronounced if a company is unfortunate enough to operate in a structurally challenged sector.
The Ghost of 1972
To illustrate the current polarization in global equity markets, we examine the performance and valuation of the 50 most highly valued stocks within the MSCI All Country World Index[2]. We have dubbed this basket of equities the reborn Global Nifty-Fifty – a reference to the early 1970s when another set of “elite” stocks were trading at mind-boggling multiples. We believe this provides an interesting history lesson as there are stark similarities in today's global equity market. The original Nifty-Fifty performed very strongly up to a certain point before valuation, cash flow, pay-back periods and tangible assets suddenly began to matter to investors. In addition, we have tracked the 50 cheapest stocks in the MSCI All Country World Index[3] – the Global Thrifty-Fifty – which hopefully provides an interesting contrast to the Global Nifty-Fifty.
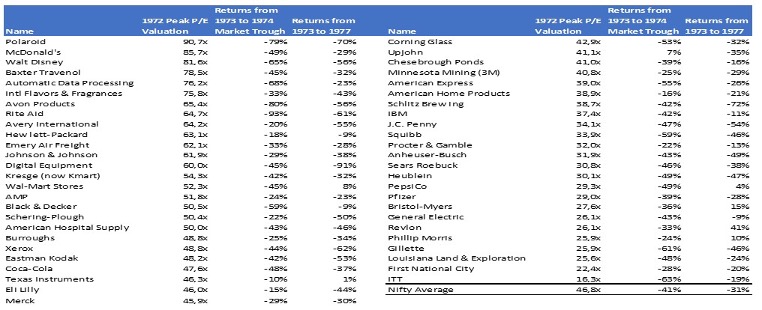
In the 1970s, the original "Nifty-Fifty" group of US “growth” stocks, massively outperformed (see Appendix 1 for more detailed information). In a volatile economic environment, characterized by low real interest rates and the Cold War, these stocks were bid up to absurd valuation levels and the events which followed the bursting of the economic bubble named The Ghost of 1972. These stocks all shared a utopian growth outlook with longer-term profits discounted using an excessively low discount rate. In 1973, however, when oil prices started to rise and inflation pushed interest rates higher, enthusiasm for the Nifty-Fifty eventually collapsed. The group failed to regain previous highs during the remainder of the decade and underperformed the S&P 500 by approximately 40%, despite over-delivering the quality they had promised by continuing to beat earnings expectations. Ignored and under-owned value investments fared much better in the correction. The key lesson is that investors with poor diversification between "growth at any price" and "value" assets suffered significant losses in this market environment.
Table 1 - The original Nifty-Fifty
Welcome to Utopia / Cuckoo Land – The "re-born" Global Nifty-Fifty
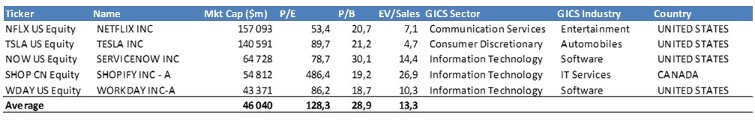
We believe that a new set of "elite" stocks such as Netflix, ServiceNow and Shopify, have emerged over the last decade, during which investors were prepared to buy "growth" and perceived "low volatility" at any price. These 50 companies also form a substantial part of global equity indices, with their combined market cap of USD 2,302 billion representing in excess of 6% of the total MSCI AC World index market cap. The table below summarizes a few members of this select club:
Table 2 - The reborn Global Nifty-Fifty
The reborn Global Nifty-Fifty trades at eye-watering multiples (13x EV/Sales, 29x Price/Book and 128x forward earnings). It is dominated by US companies, consistent with the extraordinary outperformance of the country's equity market over the last few years, particularly those from the Information Technology and Health Care sectors. Indeed, 13 of the 50 companies operate in the IT software sub-sector, which trades at a mind-blowing 16x EV/Sales, 126x Price/Earnings and 28x Price/Book.
Welcome to the Underworld - The Global Thrifty-Fifty
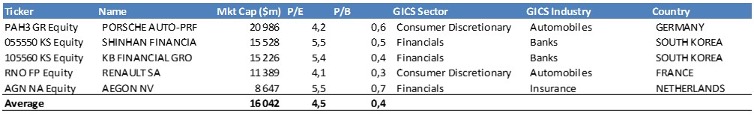
In contrast, The Underworld is represented by the 50 cheapest stocks in the MSCI AC World Index, which for instance includes Porsche, KB Financial and Gazprom and represents an area of potentially ignored value stocks. These "Thrifty-Fifty" companies are seemingly unpopular but very attractively valued, trading at an average equal weighted Price/Book multiple of 0.4x and less than 5x earnings power. The table below highlights a small sample of the group's members:
Utopia versus the Underworld
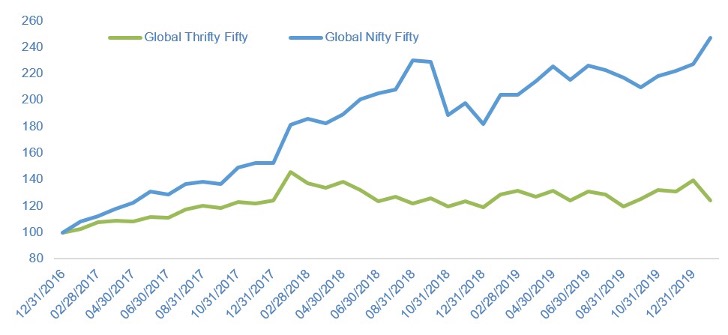
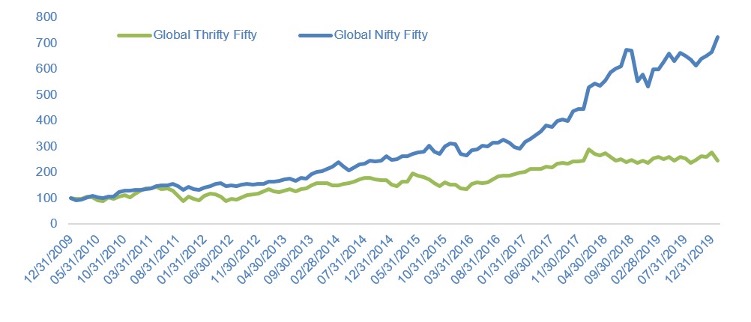
We observe a complete detachment in performance between the Nifty-Fifty and Thrifty-Fifty since the beginning of 2017 with the Nifty-Fifty outperforming by in excess of 120%. Over the last decade the accumulated difference between the two baskets is over 450%.
Chart 2 – Performance of Global Nifty-Fifty vs Thrifty-Fifty (USD) since 2017
Chart 3 – Performance of Global Nifty-Fifty vs Thrifty-Fifty (USD) since 2010
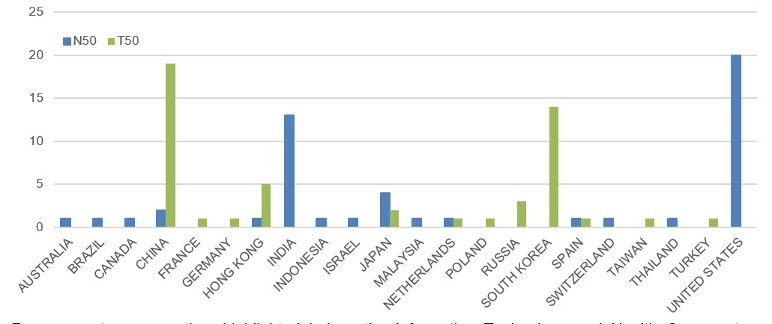
The chart below highlights the equal weighted geographical breakdown of the two groups. The difference is striking in terms of the US representing around 40% of the Nifty-Fifty, while being almost non-existent in the Thrifty-Fifty. South Korea and Japan, meanwhile, look like interesting areas within the Thrifty-Fifty, particularly as their representation would be even higher if we subtracted the substantial cross-holdings and non-core asset bases from companies in the two Asian countries.
Chart 4 - Geographic breakdown
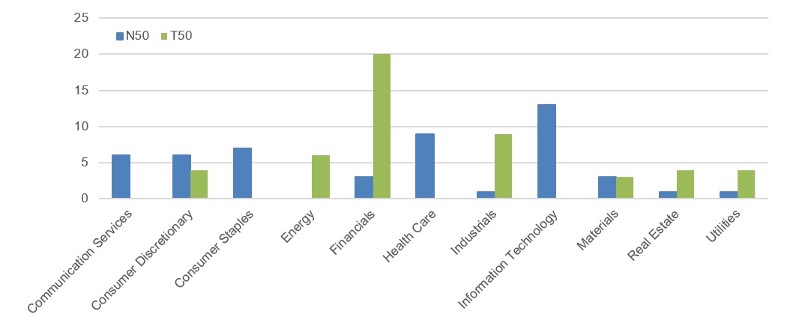
From a sector perspective, highlighted below, the Information Technology and Health Care sectors dominate the Nifty-Fifty, while Financials make up a significant part of the Thrifty-Fifty, representing more than a third of the world's cheapest stocks.
Chart 5 - Sector breakdown
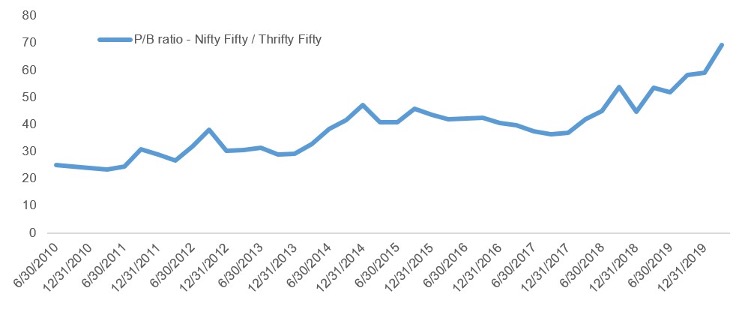
From a valuation perspective, the Nifty-Fifty has moved from a 4x EV/Sales multiple to roughly 13x since 2010 while the Thrifty-Fifty has been quite flat (0.3x EV/Sales ex financials). Price/Book in the Nifty-Fifty has expanded from roughly 16x to 28x while the equivalent multiple for the Thrifty-Fifty has contracted from 0.65x to 0.4x.
Chart 6 – Price to Book - Global Nifty-Fifty vs Global Thrifty-Fifty
Five Emerging Catalysts for Change
As long-standing value investors, we refuse to change form or shape. We are acutely aware that fashions come and go in financial markets, and the current environment represents one of the most extreme forms of collective investor herding we have observed in recent decades. In addition, it must be acknowledged that many operating in today's equity markets only have experienced the current market environment, which has been intact since the financial crisis. While nobody knows how long the current situation will last, we believe there are five key factors which might backstop and violently reverse the massive underperformance of value stocks in the mid to long-term.
1. Market anticipation of maturation of “Super-Big Tech” and its disruptive global impact. These companies, primarily in the US, have grown to represent an extremely large proportion of the global equity market. Put simply, the law of large numbers makes it virtually impossible for these companies to maintain current growth rates. We believe investors will soon start to anticipate a diminution in the disruptive impact of these companies, if we haven't already passed that point. In addition, there will be growing regulatory pressures to break up these entities as their domination – and the societal risks they pose – has grown out of proportion. At some point, these companies will be more vulnerable to cyclical impacts as growth rates fade. All the major social media companies essentially sell advertising, which represents one of the most cyclical exposures you can find, and online advertising has already reached high penetration. The market may discover that a structurally growing company is often just a young company that is yet to experience a recession. In specific cases, investors also underestimate the ability of structurally challenged dinosaurs, such as several food retail and media companies, to adapt and subsequently generate decent shareholder returns.
2. The rise of industry and strategic buyers as valuations trade at levels not seen since the financial crisis. Some market segments are currently exceptionally cheap, such as commodity/mining stocks, European banks, pulp and lumber stocks, auto and auto-part makers as well as Japanese small and mid-caps and Korean equities generally. As valuations become excessively low, private equity and industry buyers will demonstrate the “true” value of these assets as transactions will increase. The wave of activist investors targeting Japanese small and mid-caps is a result of severe undervaluation.
3. Monetary and fiscal stimulus. The market is gradually starting to sense a new wave of stimulus on the horizon, primarily via synchronized monetary easing to meet the perceived threat of a global recession. In addition, there is significant potential for immediate and substantial global fiscal stimulus, as the monetary arsenal available has largely been exhausted in recent years by QE. Our view is that even limited changes in the interest rate environment will negatively alter the valuation dynamics for the more expensive areas of the stock market and drive capital flows to higher cash yielding value equities.
4. Global trade war resolution. The US-led trade war has created substantial headwinds for value stocks, indeed all companies depending on global trade. This has further diverted capital into safe havens without assessment of the price paid for underlying assets. The recent clarification or "mini-deal" is an interesting starting point in this process and further reduced trade tension would likely be highly beneficial for value stocks.
5. Capital flow adjustments. The unprecedented flows into passive global equity funds over the past decade have been highly anti-value. As growth rates fall and expensive larger-cap companies start to underperform, these flows will gradually be directed towards smaller and less popular value stocks. Trend followers and quantitative robot-like momentum investment models will gradually turn their attention to the previously ignored areas of the global equity market and further support this capital movement.
Only dead fish follow the stream
Our core belief is that to be able to deliver competitive returns over time we need to swim against the tide. This will inevitably generate major return deviations from the underlying global equity market. In our view, being contrarian means being skilled at identifying several different market phenomena. We are not satisfied with only finding cheap assets, we want them to also be misunderstood and undervalued for the right reason. While the market is efficient in some respects, its effectiveness has fallen substantially over the last few years with the massive anti-value flows into passive instruments. The rise of trading machines and trend-following vehicles has further exacerbated this situation. Temporary market dislocations and unwarranted perceptions create opportunities for contrarian investors. Reduced analyst coverage of smaller and mid-cap stocks creates the possibility to find equities that are overly cheap.
Catalysts are also required to re-rate a stock from being undervalued to fairly priced. In our valuation framework these triggers are just as crucial as the cheapness itself and we think hard about how the market will discover it is wrong in its valuation assessment of a specific asset.
Final Words
We believe global equity investors today are faced with an extremely polarized equity market. If we are anywhere near right, the potential exists for a massive rotation from excessively priced "low-volatility growth stocks" into attractively priced value stocks with strong cash flows and tangible assets. At some point valuation will matter again. An intriguing cocktail of maturing growth rates in globally disruptive companies, adjustments in capital flows, thawing trade tensions, monetary and fiscal stimulus, and increased M&A activity could propel the rotation. At the very least, it would point to a more balanced investment approach between what has worked over the last decade versus what has been successful over the last century.
References
[1] Source: Morningstar Inc [2] Blend of 50% Price/Book and 50% Price/Earnings in rolling monthly linked return over 10 years. [3] Blend of 50% Price/Book and 50% Price/Earnings in rolling monthly linked return over 10 years.