Key Takeaways
-
Single stocks have a wide range of returns. Only about a fifth of stocks survive and outperform the market over 20-year periods.
-
They delist at a high rate, even those that have been around for a long time and have outperformed the market for 20 years.
-
The chance of any single stock outperforming the market in the future is not meaningfully different when conditioning on its past performance.
Many investors end up holding large concentrated positions in single stocks, whether as the result of employee compensation or a handsomely rewarded stock selection. Familiarity with these stocks or a successful track record while holding them may discourage investors from diversifying. Unfortunately, this can lead to one of the most well-known cautionary tales in finance: tragic declines in wealth from losses in single securities. And data on the behavior of individual stocks suggests it’s hardly rare for firms to underperform—or even go under—regardless of past performance.
Shifting Landscape
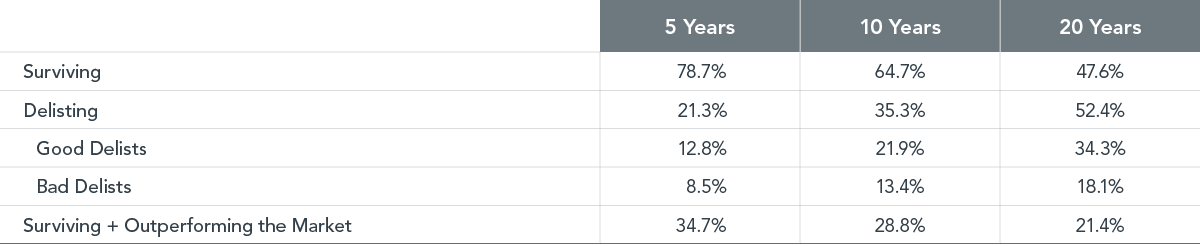
Industry development and innovation are signs of a healthy economy. Financial markets reflect this dynamic through the birth and death of public companies. As shown in Exhibit 1, this translates to meaningful turnover among individual stocks. The average survivorship statistics over rolling periods imply a little over one in five US stocks available in the market at a given time delist within five years. The survival rate goes down over longer periods, with just under half of stocks on average still trading 20 years later.
Not all delistings produce the same experience for investors. We categorize these delisting events as “good” or “bad” based on the circumstances for each stock. For example, a stock delisting due to a merger would be a good delist, as the shareholders of that stock would be compensated during the acquisition. On the other hand, a firm that delists due to its deteriorating financial condition would be a bad delist since it is an adverse outcome for investors. Over 20 years, about 18% of stocks went the bad-delist route on average.
Most of us yearn not just to survive but also to thrive. Looking at the last row of Exhibit 1, only a minority of stocks have achieved that. A little over a third of stocks on average survived and outperformed the broad US market over five years; this rate dwindled to a little more than one in five over 20 years.
EXHIBIT 1
The Good, the Bad, and the Lucky
Average survivorship and outperformance rates for cross-sections of US stocks over rolling periods formed each month, January 1927–December 2020
Past performance is not a guarantee of future results.
Source: Dimensional, using data from CRSP and Compustat. The US market includes all US common stocks without gaps in monthly data for a given rolling period. Delisted stocks with delisting code between 200 and 399 are considered good delists; bad delists are 400 or greater. Outperformance defined relative to the value-weighted market at each cross-section. Statistics reported are averages computed across rolling multiyear periods formed monthly from the cross-section of stocks available at the start of that month.
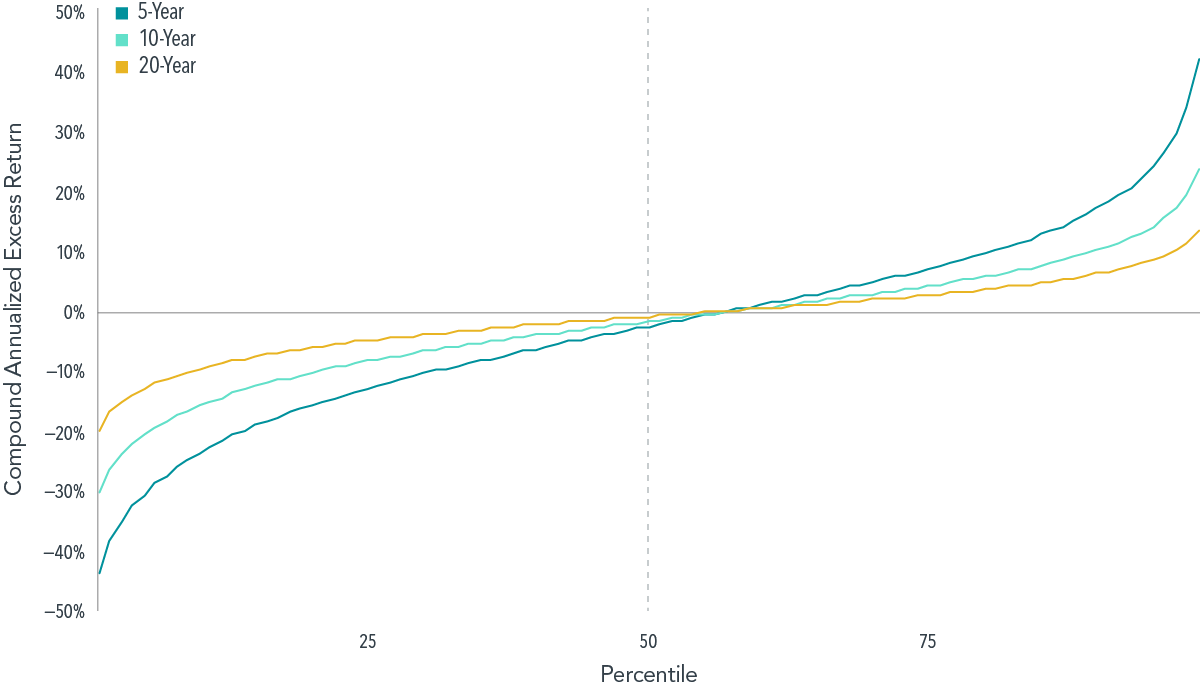
The range of returns for single stocks is vast, even among those surviving a long time. Exhibit 2 shows distributions of excess returns for surviving stocks over rolling periods of five, 10, and 20 years formed using the average cumulative return in excess of the market at each percentile. The median stock underperforms the market across all three horizons. Not until we reach the 57th, 57th, and 56th percentiles at the 5-, 10-, and 20-year horizons, respectively, do we see positive excess returns relative to the market. Although the percentage of underperformers is similar across time horizons, the magnitudes of excess returns at the extremes are smaller at longer horizons.
EXHIBIT 2
Hit Singles?
Average return in excess of the US market by percentile for the cross-section of surviving stocks over rolling periods, January 1927–December 2020
Past performance is not a guarantee of future results.
Source: Dimensional, using data from CRSP and Compustat. The US market includes all US common stocks without gaps in monthly data for a given rolling period. Excess return for each stock is the difference in annualized compound returns between the stock and the value-weighted market. Statistics reported are averages computed across rolling multiyear periods formed monthly from the cross-section of stocks available at the start of that month.
Why Diversification Pays
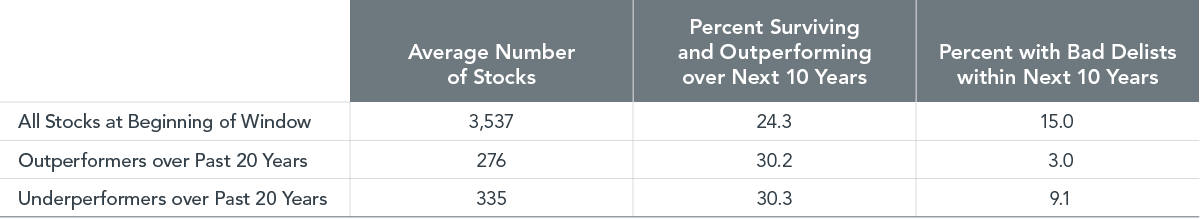
For investors holding stocks with a long history of beating the market, diversification might seem like “worsification,” reducing expected returns relative to a more concentrated approach. In many cases, these stocks represent successful companies that investors believe will continue to prosper and buck the broad trend of adverse outcomes for single stocks. Unfortunately, a long-term track record of outperformance generally has not been an indicator of future outperformance. Take, for example, stocks that have outperformed the market over the previous 20 years. Exhibit 3 shows that, on average, about 30% of these stocks continue to survive and outperform over the following 10 years. Of the stocks that have underperformed over the previous 20 years, the average subsequent outperformance rate is also 30%. In other words, winners have been no more likely than losers to beat the market in the future.
Outperformers do tend to experience a lower bad delist frequency than underperformers, which likely reflects the impact of strong performance on firm size. For example, looking at the same data set of US stocks from CRSP and Compustat, the median market cap of past winners was $4.2 billion as of December 2020—compared to $800 million for past losers. However, the bad delist rate is still 3.0% even for past outperformers; the bankruptcies of companies like Enron, Chesapeake Energy, and Circuit City remain fresh memories for many investors and former employees of those firms.
EXHIBIT 3
Repeat Customers?
Unconditional and conditional performance of individual stocks using 10-year rolling periods, January 1947–December 2020
Past performance is not a guarantee of future results.
Source: Dimensional, using data from CRSP and Compustat. Includes all US common stocks. Delisted stocks with delisting code between 200 and 399 are considered good delists; bad delists are 400 or greater. Stocks with complete prior 20-year monthly data classified as past outperformers and underperformers relative to the value-weighted market. 10-year survivorship and outperformance defined relative to the value-weighted market at each cross-section using stocks without gaps in the following 10-year monthly data. Survivorship and outperformance and bad delists are averages computed across rolling 10-year periods formed monthly from the cross-section of stocks available at the start of that month.
A well-diversified portfolio can help investors reliably capture market returns, limit individual stock risk, and improve the ability to tilt toward segments of the market with higher expected returns. Even when accounting for capital gains taxes, transitioning from a concentrated portfolio to a broadly diversified one can deliver higher growth of wealth. The long-term benefits of diversification can outweigh the short-term costs associated with liquidating outsize positions. Personalized vehicles can be used to further tailor investments, manage taxes, and suit individual considerations.
DISCLOSURES
This material is in relation to the US market and contains analysis specific to the US.
The information in this material is intended for the recipient’s background information and use only. It is provided in good faith and without any warranty or representation as to accuracy or completeness. Information and opinions presented in this material have been obtained or derived from sources believed by Dimensional to be reliable, and Dimensional has reasonable grounds to believe that all factual information herein is true as at the date of this material. It does not constitute investment advice, a recommendation, or an offer of any services or products for sale and is not intended to provide a sufficient basis on which to make an investment decision. Before acting on any information in this document, you should consider whether it is appropriate for your particular circumstances and, if appropriate, seek professional advice. It is the responsibility of any persons wishing to make a purchase to inform themselves of and observe all applicable laws and regulations. Unauthorized reproduction or transmission of this material is strictly prohibited. Dimensional accepts no responsibility for loss arising from the use of the information contained herein.
This material is not directed at any person in any jurisdiction where the availability of this material is prohibited or would subject Dimensional or its products or services to any registration, licensing, or other such legal requirements within the jurisdiction.
“Dimensional” refers to the Dimensional separate but affiliated entities generally, rather than to one particular entity. These entities are Dimensional Fund Advisors LP, Dimensional Fund Advisors Ltd., Dimensional Ireland Limited, DFA Australia Limited, Dimensional Fund Advisors Canada ULC, Dimensional Fund Advisors Pte. Ltd., Dimensional Japan Ltd. and Dimensional Hong Kong Limited. Dimensional Hong Kong Limited is licensed by the Securities and Futures Commission to conduct Type 1 (dealing in securities) regulated activities only and does not provide asset management services.
Risks
Investments involve risks. The investment return and principal value of an investment may fluctuate so that an investor’s shares, when redeemed, may be worth more or less than their original value. Past performance is not a guarantee of future results. There is no guarantee strategies will be successful.
UNITED STATES
Dimensional Fund Advisors LP is an investment advisor registered with the Securities and Exchange Commission.
Investment products: • Not FDIC Insured • Not Bank Guaranteed • May Lose Value
Dimensional Fund Advisors does not have any bank affiliates.
CANADA
These materials have been prepared by Dimensional Fund Advisors Canada ULC. The other Dimensional entities referenced herein are not registered resident investment fund managers or portfolio managers in Canada.
This material is not intended for Quebec residents.
Commissions, trailing commissions, management fees, and expenses all may be associated with mutual fund investments. Please read the prospectus before investing. Unless otherwise noted, any indicated total rates of return reflect the historical annual compounded total returns, including changes in share or unit value and reinvestment of all dividends or other distributions, and do not take into account sales, redemption, distribution, or optional charges or income taxes payable by any security holder that would have reduced returns. Mutual funds are not guaranteed, their values change frequently, and past performance may not be repeated.
AUSTRALIA
This material is issued by DFA Australia Limited (AFS Licence No. 238093, ABN 46 065 937 671). This material is provided for information only. No account has been taken of the objectives, financial situation or needs of any particular person. Accordingly, to the extent this material constitutes general financial product advice, investors should, before acting on the advice, consider the appropriateness of the advice, having regard to the investor’s objectives, financial situation and needs. Investors should also consider the target market determination that has been made for each financial product either issued or distributed by DFA Australia Limited prior to proceeding with any investment. Go to au.dimensional.com/funds to access a copy of the relevant target market determination. Any opinions expressed in this material reflect our judgement at the date of publication and are subject to change.
NEW ZEALAND
This material is issued by DFA Australia Limited (incorporated in Australia, AFS License No. 238093, ABN 46 065 937 671). This material is provided for information only. This material does not give any recommendation or opinion to acquire any financial product or any financial advice product, and is not financial advice to you or any other person. No account has been taken of the objectives, financial situation or needs of any particular person. Accordingly, investors should, before acting on the advice, consider the appropriateness of the advice, having regard to the investor’s objectives, financial situation and needs. Investors should also consider the Product Disclosure Statement (PDS) and for the Dimensional Wholesale Trusts the target market determination (TMD) that has been made for each financial product or financial advice product either issued or distributed by DFA Australia Limited prior to acquiring or continuing to hold any investment. Go to au.dimensional.com/funds to access a copy of the PDS or the relevant TMD. Any opinions expressed in this material reflect our judgement at the date of publication and are subject to change.
WHERE ISSUED BY DIMENSIONAL IRELAND LIMITED
Issued by Dimensional Ireland Limited (Dimensional Ireland), with registered office 10 Earlsfort Terrace, Dublin 2, D02 T380, Ireland. Dimensional Ireland is regulated by the Central Bank of Ireland (Registration No. C185067).
WHERE ISSUED BY DIMENSIONAL FUND ADVISORS LTD.
Issued by Dimensional Fund Advisors Ltd. (Dimensional UK), 20 Triton Street, Regent’s Place, London, NW1 3BF. Dimensional UK is authorised and regulated by the Financial Conduct Authority (FCA) - Firm Reference No. 150100.
Dimensional UK and Dimensional Ireland do not give financial advice. You are responsible for deciding whether an investment is suitable for your personal circumstances, and we recommend that a financial adviser helps you with that decision.
Dimensional UK and Dimensional Ireland issue information and materials in English and may also issue information and materials in certain other languages. The recipient’s continued acceptance of information and materials from Dimensional UK and Dimensional Ireland will constitute the recipient’s consent to be provided with such information and materials, where relevant, in more than one language.
NOTICE TO INVESTORS IN SWITZERLAND: This is advertising material.
JAPAN
For Institutional Investors and Registered Financial Instruments Intermediary Service Providers.
This material is deemed to be issued by Dimensional Japan Ltd., which is regulated by the Financial Services Agency of Japan and is registered as a Financial Instruments Firm conducting Investment Management Business and Investment Advisory and Agency Business.
Dimensional Japan Ltd.
Director of Kanto Local Finance Bureau (FIBO) No. 2683
Membership: Japan Investment Advisers Association
SINGAPORE
This material is deemed to be issued by Dimensional Fund Advisors Pte. Ltd., which is regulated by the Monetary Authority of Singapore and holds a capital markets services license for fund management.
This advertisement has not been reviewed by the Monetary Authority of Singapore and should not be shown to prospective retail investors.
FOR PROFESSIONAL INVESTORS IN HONG KONG
This material is deemed to be issued by Dimensional Hong Kong Limited (CE No. BJE760) (“Dimensional Hong Kong”), which is licensed by the Securities and Futures Commission to conduct Type 1 (dealing in securities) regulated activities only and does not provide asset management services.
This material should only be provided to “professional investors” (as defined in the Securities and Futures Ordinance [Chapter 571 of the Laws of Hong Kong] and its subsidiary legislation) and is not for use with the public. This material is not intended to constitute and does not constitute marketing of the services of Dimensional Hong Kong or its affiliates to the public of Hong Kong. When provided to prospective investors, this material forms part of, and must be provided together with, applicable fund offering materials. This material must not be provided to prospective investors on a standalone basis. Before acting on any information in this material, you should consider whether it is suitable for your particular circumstances and, if appropriate, seek professional advice.
Neither Dimensional Hong Kong nor its affiliates shall be responsible or held responsible for any content prepared by financial advisors. Financial advisors in Hong Kong shall not actively market the services of Dimensional Hong Kong or its affiliates to the Hong Kong public.