This piece is written by a third party because we think highly of the author and their perspective. It may not represent the views of Epsilon Theory or Second Foundation Partners, and should not be construed as advice to purchase or sell any security.
Overview
Last November in Blue Wave I wrote:
“The coming stimulus isn’t a panacea! It means massive deficits will persist. They will require higher taxes and incredible amounts of US Treasury issuance. Higher TAXES and rising LONG- YIELDS (all else equal) are the price for stimulus. The former drags on growth and earnings while the latter will require a Fed response that occupies its balance sheet. If the Fed does not act, higher yields will derail risk assets, just as they did at the end of 2018.”
For months, I’ve written that equity market participants have been ignoring the possible tradeoffs that come with massive stimulus: higher taxes and higher yields. I have strongly suggested that stimulus won’t place the economy back on some exceptional pre-pandemic growth trajectory. Sustainable growth comes from innovation and productivity gains – not from stimulus checks.
Moreover, I have argued that the Fed’s ability to stimulate (asset prices or the economy) has been limited because rates and yields are already so close to zero. For some time, I have reasoned the risk of a rise in yields has been asymmetrically high.[1] Now that I believe the risk of non-transitory inflation is elevated without the durable and sustainable growth to justify it (a change in view), the Fed is confronted with an even thornier problem. In stark contrast to my view, the popular meme has suggested fiscal policy wouldn’t have any negative impacts, and equities would continue to rise on the multiple expansion that low rates would assure.[2]
Yesterday, as the 10-year yield hit 1.6%, equities sold off. How much higher might yields go? Something as seemingly straightforward as the impact of inflation on bond yields is the subject of debate in academic circles. Thank goodness I’m not an academic; I care about what makes sense rather than about defending any particular school of thought. The first order effect of inflation on yields (‘reflation’) has merit, but it has its limits. Based upon Fisher’s real rate of interest framework, and despite the obvious shortcomings of his Quantity Theory of Money (QTM), this idea is generally accepted.[3] However, one must consider other factors.
Ultimately, the analysis of yields must center on market participants’ expectations for the Fed’s reaction to both inflation and Treasury supply. Said differently, term premia depend largely on uncertainty around the future path of rate policy. For now at least, it appears the current pace of Fed purchases isn’t keeping yields in check. Under current circumstances, inflation is the Fed’s kryptonite.
Discussion
Let’s discuss three forces that may move Treasury yields; they are interdependent. First, there’s inflation. Next, there’s Treasury supply. Third, there’s the Fed reaction function, which ultimately plays the most crucial role. What about the idea taught in college neoclassical economics class that the interest rate is the clearing price for money at which savings equals investment?[4] This kind of market determined interest rate equilibrium exists only in a reserve constrained regime (i.e. – gold standard), in which the monetary policy authority does not set the price (i.e. – interest rate). Today, the Fed serves as a monopolistic price setter of interest rates. By deciding how it conducts OMOs (open market operations; i.e. – the scope and duration of Treasury purchases), the Fed induences bond prices and sets interest rates. Quantitative easing is a form of OMO that acts directly on long yields, whereas traditional OMOs (in a system with fewer reserves) acted on short-duration Treasuries.[5] Consider this: theoretically, if there were no Treasury issuance, the Fed could simply create reserves and use those reverses to directly fund Treasury deficits.[6] It could do so without Treasury issuance and without creating reserves to buy those Treasuries. However, Treasury issuance and the Fed’s operations around it are the principle determinant of yields across the curve. QE was a game changer.[7]
Inflation is the only wildcard that might interfere with its game plan. As I discussed in my most recent paper Inflation Perspiration, I’m now concerned about inflation for the first time since the GFC ended. Fed communications that it intends to tolerate inflation above target under its new average inflation targeting framework will only go so far. It’s rarely had to deal with fiscal policy stimulus well in excess of what is necessary to close the output gap. Exacerbating this dynamic are still challenged supply chains. We are seeing this in semiconductors.
Commodities, too, are screaming inflation, as the fiscal stimulus and supply chain disruptions are global in scope. The Fed might want to have a conversation with the executive branch to indicate that a policy mistake could lead to inflation that forces a hike or leads to higher market yields about which the Fed decides to do nothing. Markets do that: they correct for interventions by acting in unforeseen ways. In this case, the reflexivity is occurring in yields. In coming days, it will be interesting to see whether or not the belly of the curve begins to flatten. The belly tends to move first, and if 5-year yields begin to pick up relative to 10s, then it may indicate that expectations about the probability of a hike are increasing. If 5-10 continues to steepen, it could indicate that the rise in 10-year yields is more about fears about supply.[8] Either way, long- duration yields and term premia redect uncertainty around the path of future rate policy.
Bond Yields: Inflation
Let’s first consider inflation and how it might work to impact Treasury yields by first order effect through inflation (Fisher). Consider this identity:
i = r* + E(π) where i = nominal rate, r* = the real rate, and E(π) = expected inflation.
One needn’t accept QTM, for this framework to be useful. By this definition, an inflation expectation is built into nominal yields, but it’s important to recognize that this expectation may be adopted over time as inflation becomes self-reinforcing. Arguably, yields represent the opportunity cost associated with 1) choosing saving versus consuming or 2) choosing one form of savings versus another.[9] What is the market mechanism by which yields adjust to inflation? When some economic actors perceive durable or storable goods as being more expensive in the future, their preference may shift from saving (in the form of Treasuries) to buying those goods now. That is to say, the fixed income from the Treasuries will buy less of the same refrigerator later. For this reason, they might sell Treasuries, convert them to cash, and use the cash to buy a fridge. As these expectations are adopted, more market participants sell their Treasuries, this will result in successively lower prices for Treasuries (higher yields) until the yield is eventually high enough that it meets the market expectation for inflation. A new market consensus about future inflation brings yields to a new equilibrium (all else equal and with no government intervention).[10] This is but one dynamic.
The owner of Treasuries foreseeing inflation may also decide, rather than change his/her preference to consume rather than save, to change the form of savings. Logically, s/he may wish to own an asset whose stream of cash dows (unlike Treasury bond) changes with inflation. Perhaps commercial real estate with short term leases or LIBOR based loans might fit that bill. Even when reframed as Keynes might, the reason for this change in ‘liquidity preference’ is because that person wants to transform the Treasury into cash and (quickly) redeploy the cash into an asset that benefits from inflation. No because the cash dow from Treasury ownership is less valuable in real terms.[11] In this way, inflation, disinflation and deflation may still exert some power over yields. In turn, as yields rise as part of this dynamic, this may tighten financial conditions enough to reflexitevly control demand- driven inflation without Fed intervention.[12] Perhaps, the Fed will allow that now.
Bond Yields: Reaction Functions
There’s a second order effect of inflation: it causes the Fed to react – creating uncertainty around the future path of rates and yields. It’s likely even more important than inflation first order impact, as the Fed has an arsenal of tools designed to manage rates and yields (including unlimited reserve creation as part of QE). Thus, what rising long-yields and greater term premia are saying is that the bond market expects inflation to prompt the Fed to raise rates. Mathematically, yields over ‘n’-periods are given by the geometric average of the short rates that prevailed in each period. Thus, if the expectation is for persistently low short-rates, long- yields should be anchored to that expectation.
There’s another way to think about this through bond market dynamics. If bond investors are confident the Fed won’t hike, they will buy the long-end and sell short the short-end to fund the purchase. In turn, this carry trade arb knocks down long yields towards funds. The more certain market participants are that Fed funds in anchored, the less term premium remains after the arb occurs. The risk to the carry trade always comes from a change in the cost of funding (short rates). This arbitrage is a form of duration transformation, and so is QE. When the Fed ‘quantitatively eases,’ it takes the following steps: 1) it creates excess reserves (i.e. – issues FRNs or cash); 2) it creates a reserve liability on its balance sheet; and 3) it buys Treasuries with the excess reserves. All of this effectively funds short (issues FRNs) to buy long and transforms the duration of longer- duration Treasuries into that of cash (i.e. – none). The Fed’s willingness to do this ‘arb’ is only constrained by its own expectations about inflation!
For this reason and others, the Treasury yield curve likely does not steepen as much as we’ve seen it historically. We usually see 3-month 10-year spread above 300 basis points at its widest. We’ll be lucky to see it above 200 basis points this cycle. It certainly can’t bull steepen anymore with funds at zero. The bear steepening will be self-moderating because the market and economy can’t take a move much above 2% on the 10-year, as the regression in Figure 1 shows. Lastly, were the steepening to persist for too long on persistent inflation, the Fed might be forced to hike, but it would be more likely that higher long-yields would do the Fed’s work for it. Bond volatility hit its low last September and again in March. Exhibit 2 of the Appendix may provide some context for just how much bond volatility the Fed is willing to tolerate. It seems like the MOVE index could go back to the 90, which is the regression prediction.
Bond Yields: Taper Tantrums
The Fed reaction function is also important when it comes to absorbing Treasury supply.[13] ‘Taper tantrums’ are yet another way to characterize what happens when there’s uncertainty about the path for future policy. This is what market participants generally talk about when they speak of the ‘taper tantrums’ during periods like 2013 and 2018.[14] In 2018, yields rose to 3.25% at the end of the year. It wasn’t Fed policy in reaction to inflation that did it, it was the Fed’s attempt to normalize its balance sheet. It perceived inflation was persistent enough for it to begin selling its Treasuries just prior to maturity. PCE had been above 2% since July 2018, so the Fed maintained its confidence about taper in its December meeting. A taper tantrum followed this stubborn communication around the trajectory of policy.
Equities sold off, and yields reflexively fell in response to this risk off. This led to an early 2019 inversion of the U.S Treasury yield curve. Because financial markets and the banking system, upon which the economy relies, don’t function well with an inverted curve, the Fed does not tolerate it for long.
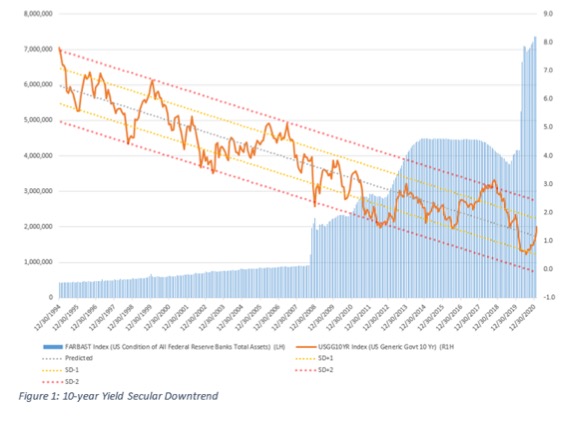
Figure 1 shows the downtrend in 10- year yields since 1994 (RH; orange). That downtrend is banded by a regression at 1SD (yellow) and 2SD (red). The regression suggests that about a month to 6-months after an extreme (2SDs) in yields, equity market corrections occur. We observed this in early 2000, mid-2007 and 2018. In turn, a yield curve inversion often follows, and the Fed is often forced to cut. That cut normally results in a bull steepening. It’s also interesting to observe that yields typically fall after the initial and extreme move above trend only to rebound to just above the trend prediction (blue dotted), just as they did in 2001 and 2008. Yields appear to be doing something similar now. In those instances, equity selloffs persisted. Here’s where the reflexivity comes in again: if equities sell off further, they may do some of the Fed’s work for it. Capital may dow back into Treasuries from equities and may drive 10-year yieldsdown – perhaps, even enough that the Fed does not need to increase the pace of bond purchases. The difference now is that yields are already so close to zero in the ZIRP (zero interest rate policy) world.
Convexity hedging is another reaction function, which is often discussed when yields begin to rise quickly. This one is market based. At times it’s overblown, but in light of how active the mortgage market has been at such low rates, it’s worth discussion here. Unlike most bonds, mortgages demonstrate negative convexity.
Convexity is the rate of change in duration when prices change. When rates fall, mortgages tend to be prepaid and refinanced. This shortens portfolio duration (negative convexity). As rates rise, and holders of mortgage securities see the duration of their portfolios increase, they sell Treasuries to shorten the duration of their portfolios.
Exacerbating the dynamic now are low bond yields; convexity is higher when interest rates are lower. Thus, smaller moves in yields mean a bigger change in portfolio durations and require more Treasury sales. At times, this activity may exacerbate moves in the Treasury market. The Fed plays a role here, too, as it owns ~35% of the MBS market and it does not hedge.
Bond Yields: Equities
I have often rebutted the argument that low rates and yields mean higher P/Es as a matter of logic. They don’t, and higher yields because of inflation without durable growth are unwelcome in equity markets. First, low yields do not drive multiples higher. Only lower yields can do that. Near the S&P’s recent high, the 10- year yield was at 61bps. Last I checked, Fed funds have been near zero for quite some time. Second, P/Es (once converted to equity yield) can’t be compared to Treasury yields until after adjusting for inflation. Only when real yield moves lower is inflation good for equities relative to Treasuries. Currently, real yields are creeping higher. Third, an assessment of P/Es requires not just a comparison to real rates, it also depends on what market participants require as an equity risk premium (ERP), which moves with expectations for earnings. [15] Surprisingly, required real ERP for equity investors has been increasing since 1990. As it has since July, Exhibit 1 of the Appendix shows that ERP (red) looks quite expensive. It is currently about 1.5SD rich to the regression prediction line (lower ERP indicates less premium and, thus, more expensive).
Not all equities will be impacted alike if inflation presents more persistently than most believe. Mature large, cap technology companies whose revenues streams from the cloud and subscription software services and whose cash flows are more like bonds than equities may be impacted more than growth technology names. Likewise CRE REITs whose portfolios have sticker, long-term leases and utilities won’t fair as well in an inflationary environment. Cyclical commodity and energy companies could benefit, albeit, eventually inflation makes life difficult if costs can’t be passed through to customers. Small caps, in particular, remain recklessly overvalued as retail flows have inflated their values.
Conclusion
The economy and markets are highly sensitive to interest rates and yields. The equity market’s reaction to 10- year yields at just over 3% in 2018 seems to provide some anecdotal evidence of this. The Fed will try to avoid persistently higher yields at all cost; normally QE would enable the Fed to fund short to buy long and keep bond yields under control. However, inflation complicates its motives. Profligate fiscal policy, unlike monetary policy, can be quite effective at prompting an inflationary overheat if the stimulus significantly enough exceeds the amount of the output gap. The first two rounds of stimulus have largely filled that gap. With annualized fourth quarter 2019 GDP at $21.75 trillion versus annualized fourth quarter 2020 GDP at $21.49 trillion, down 1.2% year-over-year, there is a good chance that another $1.9 trillion in fiscal spending will put year-over year GDP growth up between 6% and 7%. Moreover, the release of 50% of pent up savings (currently 13% of disposable income) could release another $250 billion into the economy.
Inflation caused by demolition of the output gap could be exacerbated by supply chains that are just now starting to heal from a supply-side shock. In semiconductors, the cause of the current shortage is a mixture of factors: demand spikes for consumer electronic products like laptops due to the pandemic-driven WFH trend, slowdowns in chip production also caused by the pandemic, bottlenecks due to an outsource of chip production to firms like Taiwan Semiconductor Manufacturing Company (TSMC), and lingering effects from the trade war. These shortages alongside a rally in commodity prices (supported by global stimulus especially in China), could make inflation more persistent as supply chains take time to heal. The Fed is in a tough spot. Where’s Lois Lane when you need her?
Appendix
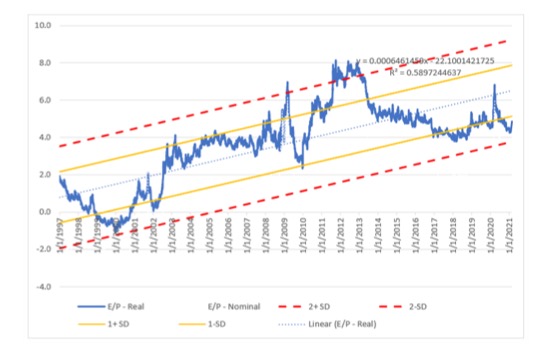
Exhibit 1:‘Real’ Equity Risk Premium (blue) Shows Equities Are > 1SD Rich versus Trend
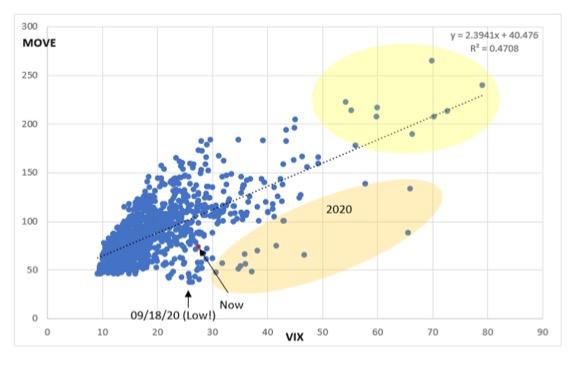
Exhibit 2: BofA MOVE Index versus the VIX
Disclaimer
AlphaOmega Advisors, LLC (AOA) does not conduct “investment research” as defined in the FCA Conduct of Business Sourcebook (COBS) section 12 nor does AOA provide “advice about securities” as defined in the Regulation of Investment Advisors by the U.S. SEC. AOA is not regulated by the SEC or by the FCA or by any other regulatory body. Nothing in this email or any attachment to it shall be deemed to constitute financial or other professional advice, and under no circumstances shall AOA be liable for any direct or indirect losses, costs or expenses that results from the content of this email or any attachment to it. AOA has an internal policy designed to minimize the risk of receiving or misusing confidential or potentially material non-public information.
The views and conclusions expressed here may be changed without notice. AOA, its partners and employees make no representation about the completeness or accuracy of the data, calculations, information or opinions included in or attached to this email, is based on information received or developed by AOA as of the date hereof, and AOA shall be under no obligation to provide any notice if such data, calculations, information or opinions expressed in this email or any attachment to it changes. Any such research may not be copied, redistributed, or reproduced in part or whole without AOA’s express written permission.
The prices of securities referred to in any research is based on pricing as of the date the research was conducted, may rise or fall at any time thereafter, and past performance and forecasts should not be treated as a reliable indicator of future performance or results. This email and any attachment to it is not directed to you if AOA is barred from doing so in your jurisdiction. This email and any attachment to it is for informational purposes only and does not constitute an offer or solicitation to buy or sell securities or to enter into any investment transaction or use any investment service. AOA is not affliated with any U.S. or foreign broker dealer. AOA or its principals may own securities discussed herein.
Notes
[1] Please see Check In: To Infinity and Beyond, August 17th, 2020 and see Exhibit 2 of the Appendix.
[2] I have continuously asserted that low rates alone do not lead to multiple expansion; only lower rates can do that and only assuming that risk premia stay constant. So close to the zero bound, traditional policy is stuck.
[3] As Eric Tymoigne of the Levy Institute argues: “Changes in interest rates do not reflect changes in the opportunity cost induced by inflation in the present/future consumption arbitrage, they reflect changes in uncertainty that affect the stock equilibrium between liquid and illiquid assets.” As it turns out, this statement is far less profound than it first appears because, as he later states, “[the] condition of indifference [due to expectations for changes in interact rates] may include the concerns about inflation via the introduction of an inflation premium in nominal rates, but these concerns are included in the broader concerns of liquidity and solvency.”
[4] This identity holds in a closed economy.
[5] The plethora of system reserves necessitated a shift to the use of IOER as the Fed’s principal tool to manage to the funds target rate.
[6] Of course, this isn’t the way the system works!
[7] QE also helps the Fed signal its commitment to its policy to keep rates anchored.
[8] The two are not mutually exclusive as long-yields are the geometric average of short-yields.
[9] Keynesians disagree on what I take to be a technicality.
[10] This of course, assumes that different market participants have different expectations for inflation. I don’t see this as a fallacy of composition, as this is often the way markets work as they move in and out of equilibria, which are something of an academic fiction and if they do exist are usually short-lived, as George Soros argues in his Alchemy of Finance.
[11] As I will point out, it is the comparison of real 10-year yield to earnings yield that may make equities less attractive relative to bonds as inflation rises – but only if real yields are rising, too. There are also other factors to consider.
[12] On the other hand, some believe that most inflation comes from supply shortages that tighter financial conditions will only exacerbate by constraining supply further (i.e. – limiting the availability of loans that might be used to increase capacity). This is the dip side of the argument I’ve been making that low rates create overcapacity that keeps inflation low.
[13] This could also be looked at as constraining the supply to non-Fed buyers.
[14] Risk-asset markets rallied significantly because the Fed was focused on lowering yields on MBS, and that QE program purchased mostly MBS securities. This program had palpable economic impact through lower borrowing costs for homes. Recall that this program was announced in September 2012, and while focused on MBS, it also helped keep longer-dated yields down – that is, until the Fed announced a taper in June 2013. The 10-year yield rose quickly in expectation of taper and the Fed was ultimately forced (in September 2013) announce no taper would occur and the 10-year yield fell again throughout 2014.
[15] ERPf =E/Pf – (Y – E(π)) where E/Pf is the forward earnings yield, Y is the nominal yield, and E(π) is expected inflation.
DISCLOSURES
This commentary is being provided to you as general information only and should not be taken as investment advice. The opinions expressed in these materials represent the personal views of the author(s). It is not investment research or a research recommendation, as it does not constitute substantive research or analysis. Any action that you take as a result of information contained in this document is ultimately your responsibility. Epsilon Theory will not accept liability for any loss or damage, including without limitation to any loss of proRt, which may arise directly or indirectly from use of or reliance on such information. Consult your investment advisor before making any investment decisions. It must be noted, that no one can accurately predict the future of the market with certainty or guarantee future investment performance. Past performance is not a guarantee of future results.
Statements in this communication are forward-looking statements. The forward- looking statements and other views expressed herein are as of the date of this publication. Actual future results or occurrences may differ signiRcantly from those anticipated in any forward-looking statements, and there is no guarantee that any predictions will come to pass. The views expressed herein are subject to change at any time, due to numerous market and other factors. Epsilon Theory disclaims any obligation to update publicly or revise any forward-looking statements or views expressed herein. This information is neither an offer to sell nor a solicitation of any offer to buy any securities. This commentary has been prepared without regard to the individual Rnancial circumstances and objectives of persons who receive it. Epsilon Theory recommends that investors independently evaluate particular investments and strategies, and encourages investors to seek the advice of a Rnancial advisor. The appropriateness of a particular investment or strategy will depend on an investor’s individual circumstances and objectives.