US money growth, on a range of measures, picked up significantly during H2 2019. This suggests a revival of economic momentum in mid-2020 but near-term data could be surprisingly weak. The monetary acceleration, moreover, was unusual and could be in the process of reversing equally sharply.
Simon Ward, Economic Adviser
Janus Henderson Investors, January 2020
US money growth, on a range of measures, picked up significantly during H2 2019. This suggests a revival of economic momentum in mid-2020 but near-term data could be surprisingly weak. The monetary acceleration, moreover, was unusual and could be in the process of reversing equally sharply.
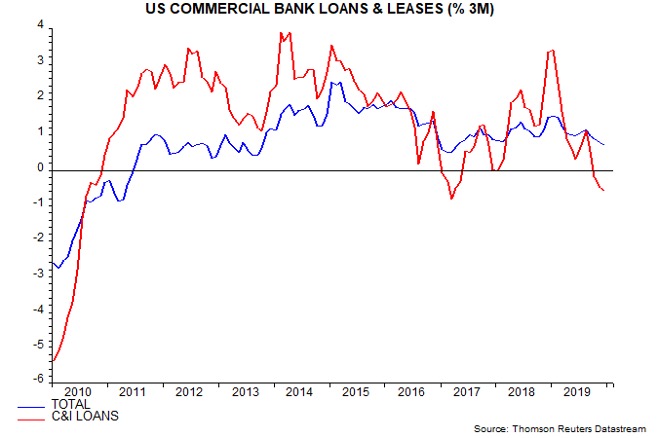
The rise in money growth was not due to bank lending. Three-month growth of commercial bank loans and leases moderated through 2019, reflecting a shift from strength to weakness in commercial and industrial (C&I) loans – see first chart.
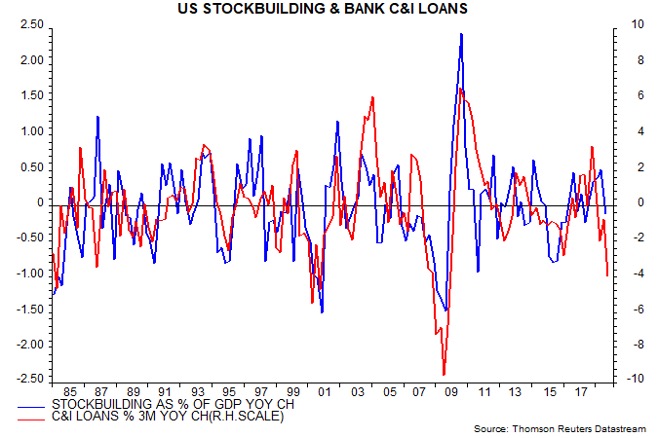
As previously discussed, C&I loan demand is correlated with the stockbuilding (inventory) cycle. The year-on-year C&I loan “impulse” at end-December, i.e. the change in three-month momentum from a year earlier, was the most negative since 2009, suggesting a large stockbuilding drag on annual GDP growth – second chart.
The rise in money growth was not primarily due to the Fed’s balance sheet expansion, which started in September. The Fed initially injected reserves via repo operations, which, when conducted with banks, have no direct impact on the stock of (broad) money. Treasury bill purchases have an impact only to the extent that they are purchased from non-banks.
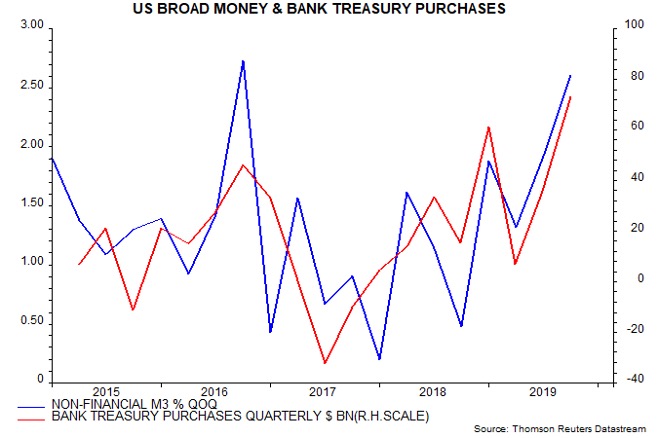
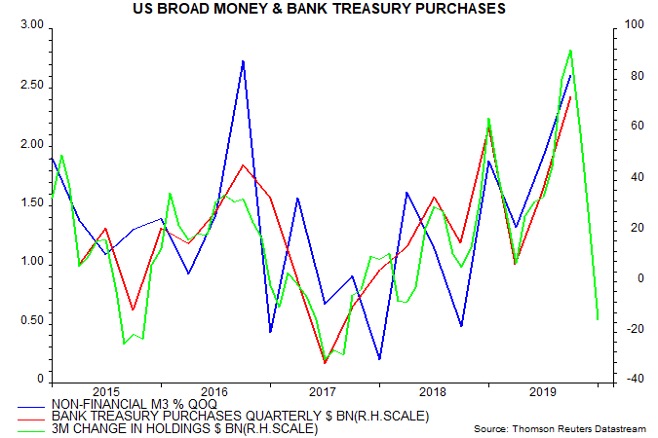
The key driver of monetary acceleration, instead, appears to have been strong buying of Treasuries by banks. Broad money growth, as measured by the quarterly non-financial M3 aggregate preferred here, has shown an unusually high correlation in recent years with such purchases, which reached a dollar record in Q3 – third chart.
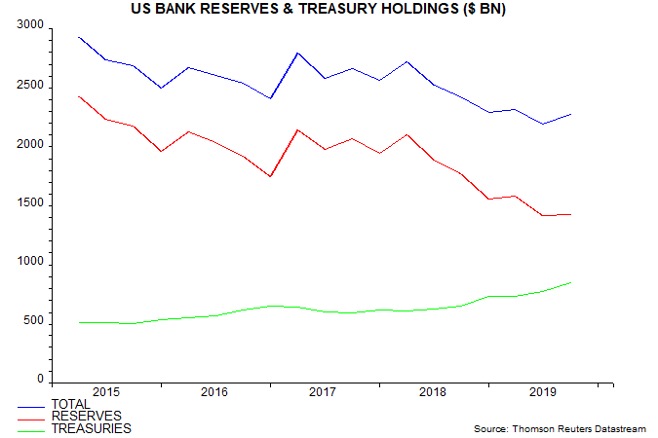
Banks stepped up Treasury buying to offset an excessive fall in their holdings of high quality liquid assets caused by the reserves drain from the Fed’s QT operations – fourth chart.
The Fed’s subsequent liquidity injection has boosted reserves and removed banks’ incentive to buy Treasuries. Weekly data on commercial banks’ assets suggest that purchases have dried up – fifth chart. (The weekly numbers are only a rough guide as they incorporate valuation effects.)
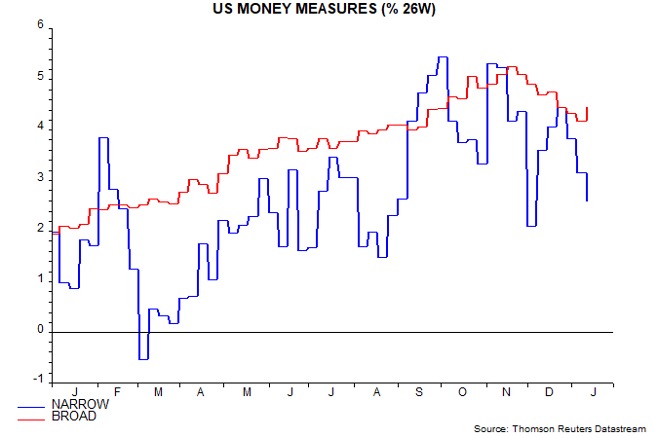
This cessation is being reflected in monetary data: six-month growth rates of weekly narrow and broad money measures have moderated since November – sixth chart. Further weakness would temper the positive signal from the earlier pick-up and suggest a renewed slowdown in economic momentum later in 2020.
These are the views of the author at the time of publication and may differ from the views of other individuals/teams at Janus Henderson Investors. Any securities, funds, sectors and indices mentioned within this article do not constitute or form part of any offer or solicitation to buy or sell them.
Past performance is not a guide to future performance. The value of an investment and the income from it can fall as well as rise and you may not get back the amount originally invested.
The information in this article does not qualify as an investment recommendation.
For promotional purposes.