Why an inverted yield curve isn’t a hair trigger for stocks.
Luke Puetz
Fisher Investments MarketMinder, 08/26/2019
When the 2-year to 10-year section of the US yield curve inverted last week, headlines hyped what was supposedly the first inversion since 2007, warning of an allegedly impending recession. Ironically, few seemed to recall the more meaningful section of the curve—the spread between 3-month and 10-year yields—inverted for the first time this cycle in March. Then as now, many feared a US recession would closely follow as the yield curve has historically been a decent forward-looking indicator of recession. Yet yield curve inversion has not been reliable for timing purposes, and we don’t believe the recent inversion is reason to become bearish immediately.
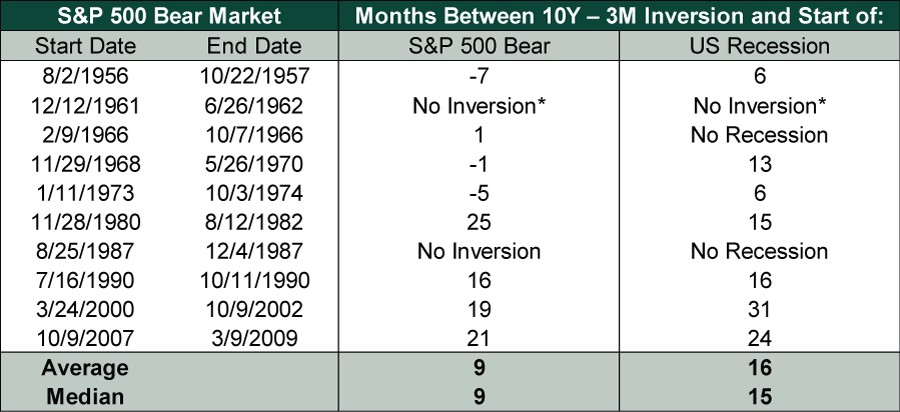
Exhibit 1 shows the time elapsed from initial yield curve inversion to the beginning of S&P 500 bear markets. The window is irregular, ranging from 25 months before to 7 months after the start of a bear market. In the past four instances, the lag from initial yield curve inversion to bear market averaged 20 months.
Exhibit 1: Initial 10-Year – 3-Month US Treasury Yield Spread Inversions and Time to S&P 500 Bear Markets and US Recessions
Sources: Global Financial Data, Inc. and FactSet, as of 3/26/2019. *10-year – 3-month US Treasury yield spread came close to inverting (+0.03%) on 1/6/1960, 4 months before the next recession and 23 months before the next bear market.
Bank Fundamentals: Inverted yield curves can signal weaker bank lending fundamentals because they affect banks’ profit margins. When yield curves are positively sloped, long rates exceed short rates. Banks borrow at short rates and lend at longer-term rates. Therefore, the spread between long and short government rates influences bank profits. Because inverted yield curves mean short rates are above long, they signal potentially weaker bank lending—not enough profit incentive. However, banks generally lend at higher rates than similar maturity US Treasury yields—they add a spread based on their assessment of risk. Further, funding costs may undershoot short-term rates if banks have ample deposits. This logic applies today, with bank deposit rates broadly trailing 3-month Treasury yields. Hence, the yield spread is only a rough approximation of bank interest margins—one reason we don’t think it wise to become bearish at the first sign of inversion.
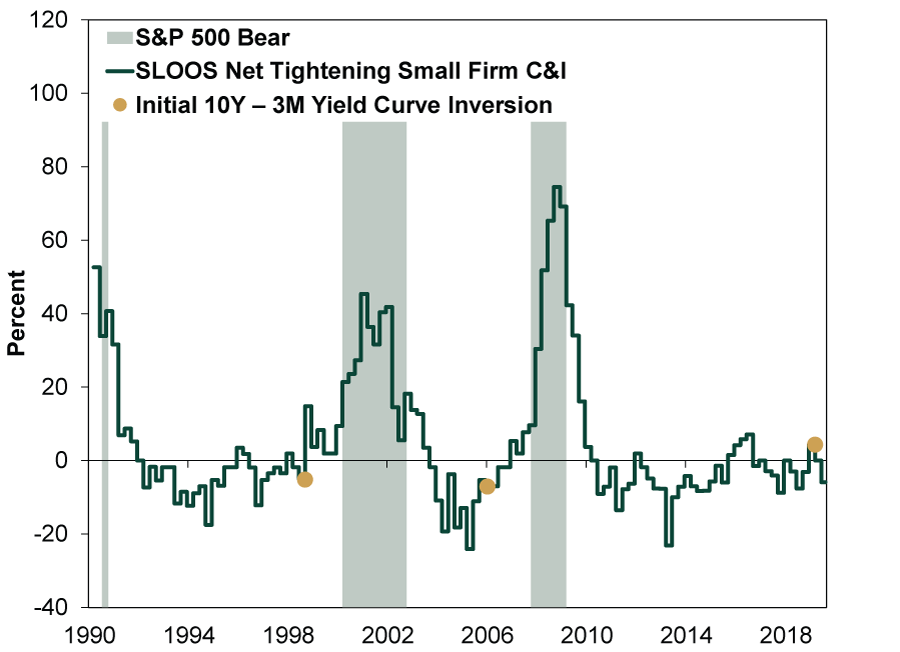
The Federal Reserve’s quarterly Senior Loan Officer Opinion Survey helps show whether an inverted yield curve has tightened lending conditions. Exhibit 2 shows the net percentage of survey respondents reporting tighter loan standards for commercial and industrial loans to small businesses, with initial yield curve inversions highlighted. In recent decades, bear markets didn’t immediately follow inversion. Instead, they developed at a lag after credit conditions tightened. The most recent survey, released after the yield curve inverted, showed conditions loosening, not tightening.
Sources: FactSet and Federal Reserve, as of 8/19/2019. Senior Loan Officer Opinion Survey, Net % of Domestic Respondents Tightening Standards for C&I Loans, Small Firms, Q1 1990 – Q3 2019.
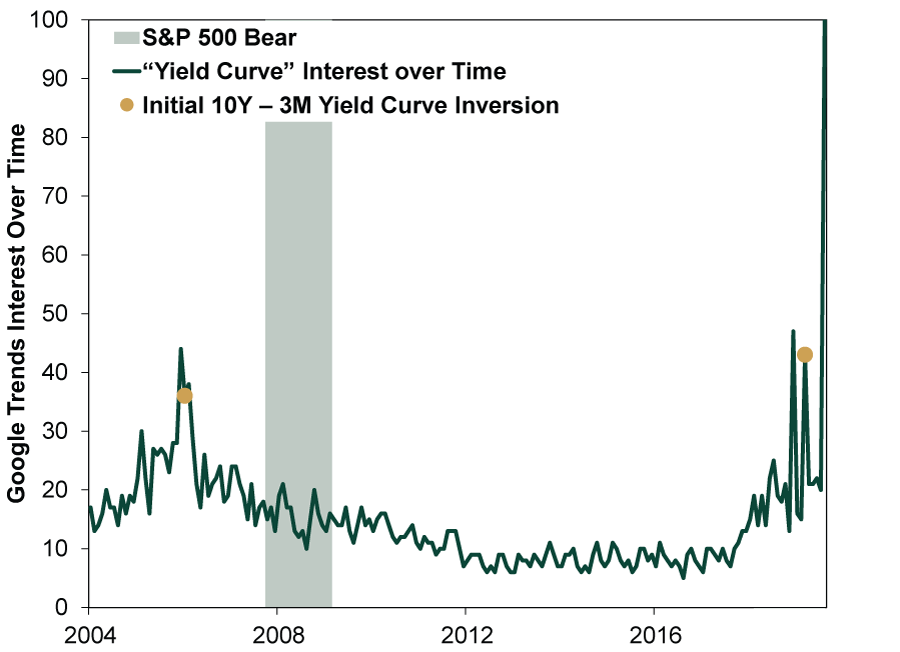
Sentiment: Another potential explanation for the lag from initial inversion to the start of a bear market is sentiment. Markets are efficient discounters of all widely known information, so when an inverted yield curve hogs headlines, those fears are likely already reflected in stock prices. Exhibit 3 shows interest in the yield curve over time based on Google searches, with initial yield curve inversions highlighted. In the last cycle, the bear began well after the yield curve faded from the popular psyche. Because sentiment is such an important driver of near-term market movements, we believe an inverted yield curve is probably more dangerous after everyone else has forgotten about it.
Exhibit 3: Google Trends Interest Over Time for the “Yield Curve”
Source: Google Trends and FactSet, as of 8/19/2019. Monthly data January 2004 – August 2019. Google Trends compares search popularity to the term’s peak popularity, which it pins at 100.
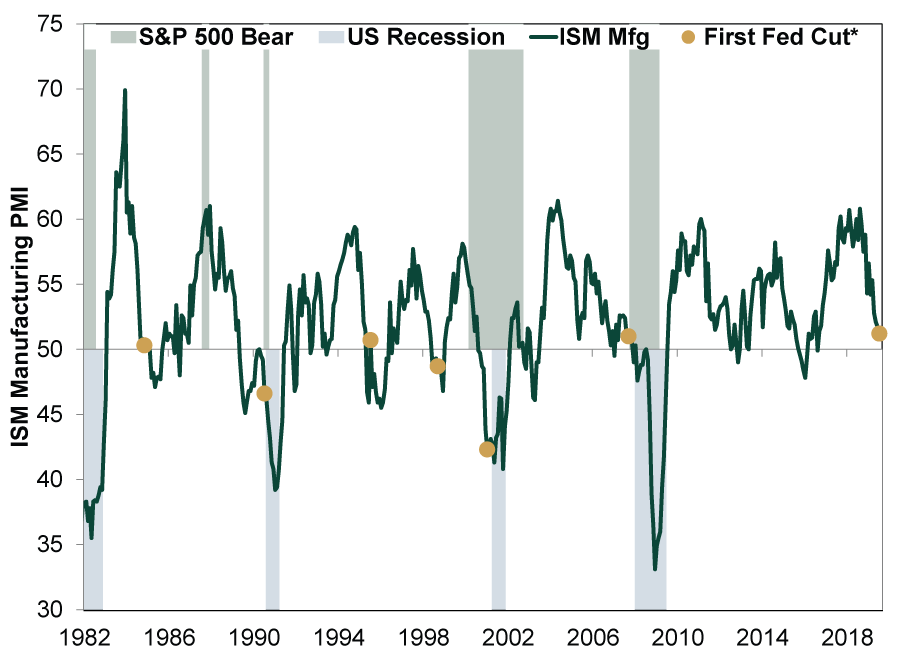
Mid-Cycle Slowdowns: One narrative surrounding the present yield curve inversion states investors foresee a recession and are therefore betting the Federal Reserve will cut short-term interest rates. Perhaps the Fed will follow through with more rate cuts, but this isn’t automatically a sign recession looms. Yes, emerging evidence of a US recession is why policymakers eased in 1990, 2001 and 2007. Yet throughout history, they have also cut rates during a “mid-cycle slowdown,” e,g., 1984, 1995 and 1998. Certain sectors of the economy, such as manufacturing, may be weak during such periods. Exhibit 4 shows the US Institute for Supply Management's (ISM) Manufacturing Purchasing Managers' Index (PMI), with initial Fed rate cuts highlighted. If a yield curve inversion is driven by expectations of rate cuts due to a mid-cycle slowdown, then investors taking a bearish stance could be walking into a trap. In our opinion, the current circumstances more closely resemble the mid-cycle slowdown scenario.
Exhibit 4: ISM Manufacturing PMI Highlighted With Initial Fed Rate Cuts
Source: Institute for Supply Management, FactSet and Economic Cycle Research Institute, as of 8/19/2019. ISM Manufacturing Purchasing Managers’ Index, January 1982 – July 2019. *Federal Funds Target Rate after 12/31/1985. Federal Reserve Discount Rate prior to 12/31/1985.