Mind over matter: How we react to an inverted yield curve is more important than the inversion itself
Determining whether an inverted yield curve signals a US or global recession continues to focus the minds of investors in 2019. Mark Robertson explains why our actions will matter more in determining whether a recession is on the horizon than what can be a misleading indicator.
Mark Robertson
Aviva Investors,
30 September 2019
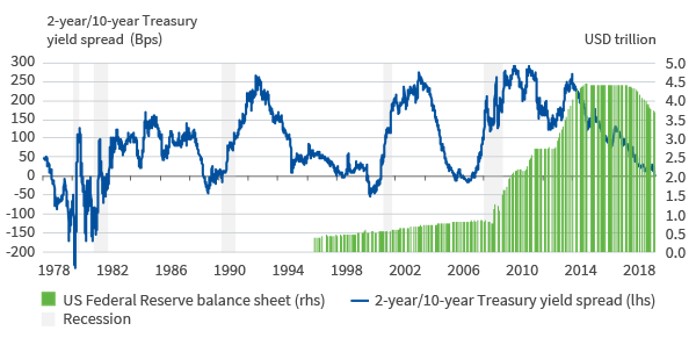
For the first time since 2007, the two-year/ten-year Treasury yield spread turned negative on August 14, once again reviving fears of a recession. Given that previous yield curve inversions have preceded each of the past five recessions since the early 1980s, these concerns are understandable.
Figure 1: US yield curve inversion: 2-year/10-year Treasury
Source: Macrobond
The recent inversion, alongside a new record low 30-year bond yield, have followed the intense bull-flattening trade seen since the end of July. These, in turn, have been driven by fears around escalating trade war risks and a weaker global growth outlook. The market is pricing in lower odds that this is a mid-cycle downturn and higher odds it could be the beginning of a recession.
Predictive signals have always held a seductive allure in financial markets. However, while an inverted US yield curve undoubtedly conveys a feeling of unease among investors, it should be remembered recessions are not that common. This means it is statistically impossible for any single recession indicator to be robust. Worse still, the unprecedented quantitative easing (QE) interventions of the last decade may have impaired the yield curve’s signaling capacity. After all, flatter yield curves are a natural consequence of developed market central banks’ use of QE to intentionally lower long-term yields in an effort to foster investment and consumption.
History also reminds us the threat is not necessarily imminent. Empirical research from Oxford Economics, a consultancy, shows that over the past five recessions the lead time between inversion and the onset of recession has averaged approximately 21.5 months. Indeed, the range of the lead time is quite wide, spanning from 10.5 months ahead of the 1981-1982 recession to 36 months ahead of the 2001 recession.1
Nothing to fear but fear itself
Uncertainties regarding timing and signaling quality aside, how investors behave will be key. When economic agents’ expectations for the future rapidly deteriorate, either due to new information that negates their prior beliefs or due to an external shock, this causes a contraction in demand and spending. Aggregated up, it can be disastrous as the multiplier effect works in reverse: the reduction of one agent’s spending leads to a decline in another’s income, and compounds across the entire economy.
The issue here is that sometimes a belief can be self-fulfilling. Biases such as loss-aversion, where investors often fear losses more than they value equivalent gains, and confirmation bias, where investors place greater weight on information that supports their thesis, can weigh on market sentiment – even when the underlying fundamentals may not warrant such a negative view. There is a real risk businesses and consumers take the yield curve inversion as a sign of an impending recession, raise their precautionary savings and lower investment spending; thereby triggering the recessionary conditions they were seeking to avoid.
Who to believe: bonds or equities?
Paradoxically, even though macroeconomic indicators have weakened and bond markets have adjusted to reflect this, many major equity indices sit close to recent highs. While this may reflect a belief in the omnipotence of central banks and their ability to protect asset prices, it is also likely a reflection of the fact that, in a low yield world where investors still need income, equities are looking ever more attractive.
While markets have come to rely on their interventions for over a decade, there is only so much that central banks can do to restore confidence once they are at, or through, the zero-lower bound. This is the difficulty faced by the European Central Bank and the Bank of Japan as they seek to revive the animal spirits of investors, consumers and businesses.
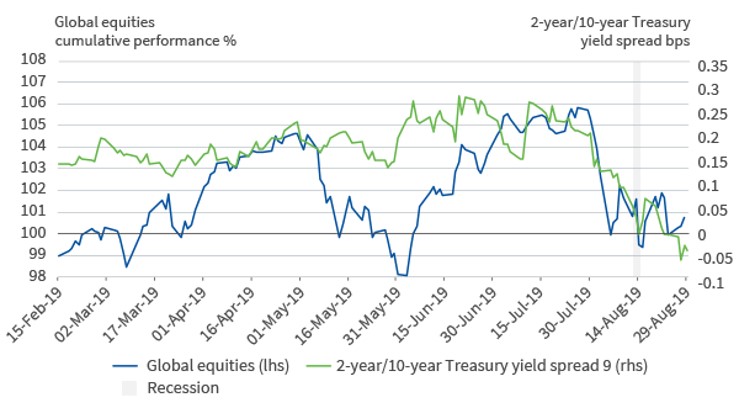
Global equities have moved in tandem with the yield curve moves this year, shedding around two per cent on the day the curve momentarily inverted on August 14.
Figure 2: Moving in sync: Global equities and the US yield curve
Source: Bloomberg as at 29 August 2019
Though notable, daily sell-offs of this of this magnitude are not an anomaly. The unintended repercussions of rhetoric relating to yield curve inversion and recession fears could dampen market sentiment, individuals’ income expectations and ultimately consumption and investment.
Such fears seem overplayed, however. A US recession is unlikely on a medium-term horizon with GDP continuing to grow above its potential, monetary policy uncertainty receding and a strong labour market, all of which have boosted consumer confidence.
Political risk remains the big threat to global growth, whether emanating from the US-China trade war, Brexit, or other geopolitical risks that reside in the background before taking their place at the forefront of investor concerns. Absent this political uncertainty, especially around the US-China trade war, it is likely business confidence and investment would be higher and the fears around a recession would be lower.
The latest yield curve inversion should therefore be seen as a warning sign, not a reason to panic.
Reference
1. Oxford Economics - Research Briefing | US: “Despite curve inversion, don’t write off the economy yet”. John Canavan 14th August 2019