With financial markets experiencing dramatic swings as a result of the coronavirus (COVID-19) pandemic, getting caught up in daily movements is all too easy. The temptation to sell in times of stress can also be overwhelming. However, if history is any guide, the potential short-term benefits from exiting are often outweighed by the long-term benefits of staying the course. While the effects of COVID-19 on emerging market debt (EMD) are likely to be different from past drawdowns, putting the recent moves into their longer-term context highlights the historical attractiveness of the asset class.
Since the inception of the JP Morgan EMBI Global Index in 1994, there have been six drawdowns greater than ten per cent (see Figure 1). Over the same period, the index has returned a cumulative 631 per cent, including the recent 18 per cent COVID-19-induced sell off.
Figure 1: EMD hard currency benchmark drawdowns and returns
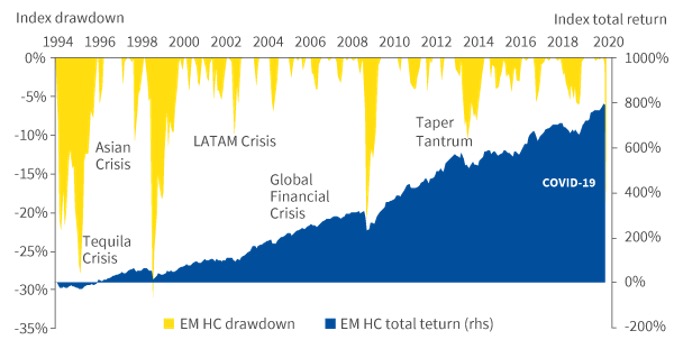
Source: Aviva Investors, as at 23 March 2020. Index returns based on JP Morgan EMBI Global Index USD. Past performance is not a guide to future returns
The chart and table above highlight not just the extent of the drawdowns experienced by hard currency EMD investors, but also the relatively quick nature of recovery in most cases. Looking at the most significant drawdowns on the index (greater than ten per cent), the average recovery period was nine months from the trough of the drawdown.
Significant drawdowns also tend to be followed by periods of strong performance; for example, the average 12-month return following a significant drawdown is about 30 per cent. Using the average drawdown of 18.5 per cent and the average 12-month recovery value of 30.2 per cent, remaining invested through the drawdown and subsequent 12-month period would result in a net positive return of 6.5 per cent on average.
While these numbers are based on the average drawdowns and recovery values (and investors should always remember that past performance is not a guide to future returns), this analysis does highlight the benefits of staying invested in the asset class.
Investor behaviour
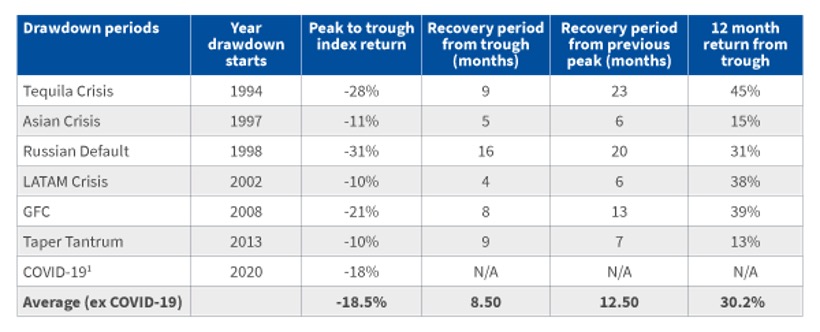
As much as we may appreciate the importance of staying invested, investor behaviour implies we aren’t good at adopting it in practice. As Figure 2 shows, there is a strong correlation between index returns and retail investor flows. By effectively selling dips and buying tops, investors have missed out on some of the strongest periods of performance.
Figure 2: EMD asset flows vs. index returns
Source: Aviva Investors, JP Morgan, as at 20 March 2020. Index returns based on JP Morgan EMBI Global Diversified Index USD. Past performance is not a guide to future returns
Positioning for a recovery
In the midst of an 18 per cent drawdown, finding positives can seem like looking for a needle in a haystack. At the end of February, total fund flows into EMD stood at US$11.2 billion for the year. By 26 March, over US$40 billion had been taken out the asset class in a little over four weeks. When outflows are this large and liquidity conditions so constrained, selling becomes indiscriminate, with good and bad countries and companies uniformly punished.
This panic selling could create opportunities for those who are willing and able to remain invested. A scramble for liquidity has been responsible for much of the selling so far. However, as initial panic subsides and investors begin to focus more on fundamentals, opportunities are likely to emerge in countries better positioned to cope with lower commodity prices, tourism revenues and growth shocks.
The journey may still be bumpy for investors who stay the course. However, those sitting on the side-line attempting to time their re-entry point may find that a difficult task. A more prudent policy may be to do nothing at this point. As the old adage says, “It’s about time in the markets, not timing the markets”.
Appendix: EMD Hard Currency Drawdowns
- The Tequila Crisis: A sudden devaluation of the Mexican Peso, which caused other currencies in Latin America to decline as well.
- Asian Crisis: A sequence of currency devaluations and stock market declines that began Thailand and spread through many Asian markets.
- Russian Default: Russian stock, bond and currency market collapse triggered by the devaluation of the Russian rouble.
- LATAM Crisis: Default on Argentinian sovereign USD denominated debt and currency depreciation in Argentina Brazil and Uruguay.
- Global Financial Crisis: Worldwide economic crisis triggered by losses in subprime mortgage market in the United States, and it developed into an international banking crisis.
- Taper Tantrum: A spike in government bond yields and sell off in risk assets caused by Federal Reserve’s plan to begin winding down its quantitative easing (QE) program.
- COVID-19: Global sell off in risk assets caused by fears over the economic fallout of the COVID-19 outbreak.
Reference
- Return figures related to COVID-19 are based on maximum drawdown to date.Note: Recovery period from trough is the period it takes for the index to rise from the lowest point of the drawdown back to the level prior to the drawdown. See Appendix for more information about each drawdown period