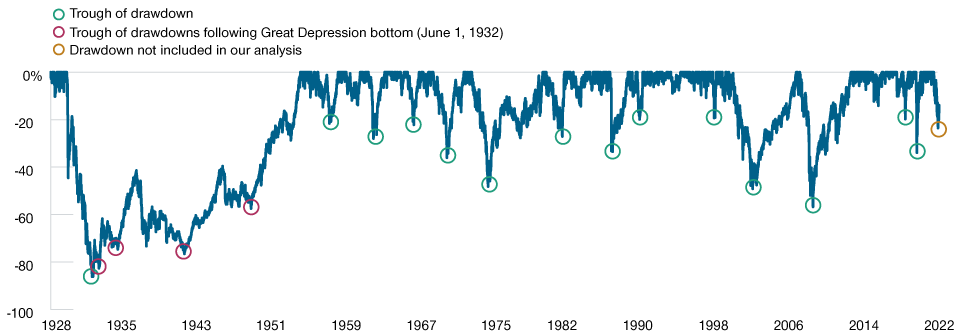
Historical drawdowns of 15% or more in the S&P 500 Index*
Historical drawdowns of 15% or more in the S&P 500 Index*
Past performance is not a reliable indicator of future performance.
As of July 31, 2022.
*We used S&P 500 Index price data from January 3, 1928, through July 31, 2022, to identify drawdowns of 15% or more from a previous absolute market peak. We then identified the date marking the trough for each drawdown. However, in order to capture market sell‑offs during and immediately after the Great Depression (with troughs on February 27, 1933, March 14, 1935, April 28, 1942, and June 13, 1949), we set June 1, 1932, as the new floor and identified subsequent market peaks and drawdowns from that date. The most recent S&P 500 sell‑off—the market drawdown in early 2022—was not included in our analysis. The most recent trough is marked as not included in the analysis (yellow circle in key)
Source: Bloomberg Finance L.P. (see Additional Disclosures). All data analysis by T. Rowe Price.
The above chart is sourced from the report "Fed’s Inflation Fight Likely to Persist", by Sebastien Page and Som Priestley, T. Rowe Price, September 2022.