20 Years Ended 31 December 2022
20 Years Ended 31 December 2022
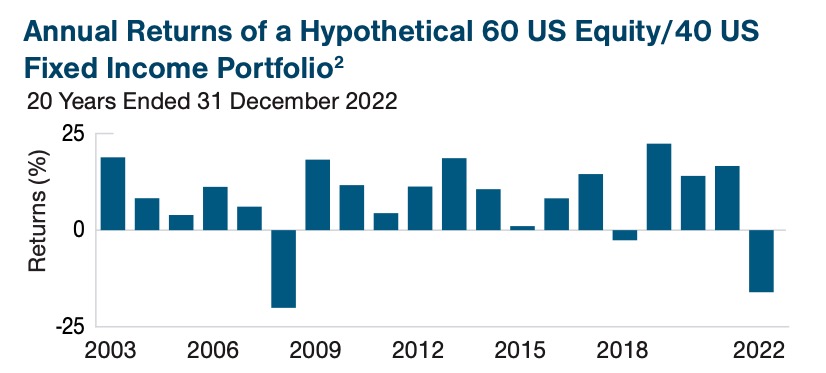
Past performance and hypothetical performance are not reliable indicators of future performance. Actual performance will vary, perhaps materially, from the performance shown. The performance of the hypothetical portfolio does not include fees or costs. If these fees were deducted from the returns shown, the returns would be lower.
2. Source: Bloomberg Finance L.P. References the S&P 500 and Bloomberg U.S. Aggregate Bond Indices. Figures shown in US dollars. Please see Additional Disclosures for more information about this sourcing information.
This chart is sourced from the report Global Asset Allocation: The View From Europe, T. Rowe Price, February 2023